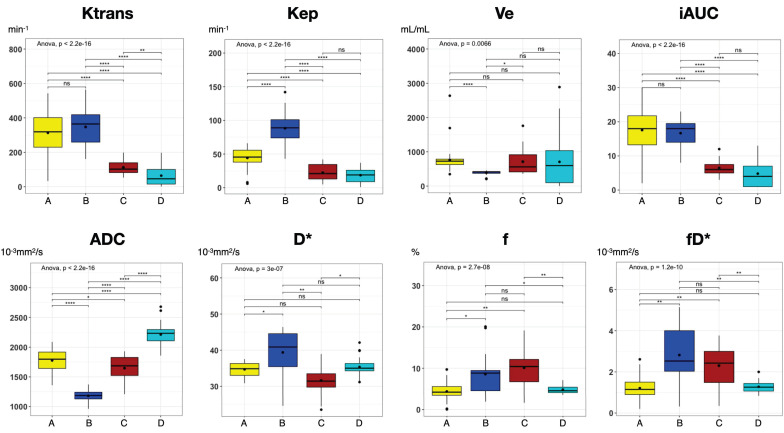
Figure 8.
Boxplots of all parametric MRI parameters for each distinct Region A-D as shown in Figure 7. Boxplots: middle line represents the median; the upper and lower ends of the box represent the 75th and 25th percentiles, respectively. Black dot in Box represents the mean. Color-coding identical to Figure 7: region A, yellow; region B blue; region C, red, region D, cyan. P values were obtained using one-way ANOVA, followed by the t-tests (Bonferroni-Holm adjusted) for comparison of mean values between regions. *, p < 0.05; **, p < 0.01; ***, p < 0.001; ****, p < 0.0001; ns, not significant.

