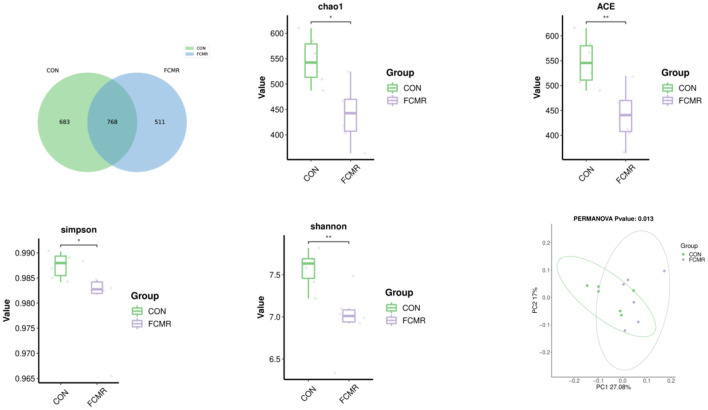
Figure 3.
The effects of FCMR addition to the diet on the Venn diagram, α-diversity, and β-diversity of broiler cecum microorganisms. Principal coordinate analysis (PCoA) calculated based on weighted UniFrac distances from the ASV abundance matrix; *indicates that there is a considerable difference between the two groups (*p < 0.05, **p < 0.01).

