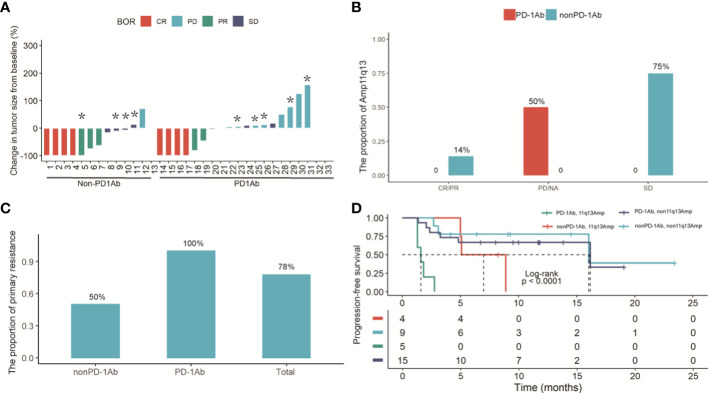
Figure 3.
(A) Waterfall plot of the maximum reduction in target lesion diameter in 33 patients with recurrent HCC and initially diagnosed uHCC. Lesions caused by the death were not evaluable in 3 patients. (B) Histogram analysis of the proportion of the Amp11q13 and tumor response in PD-1Ab and nonPD-L1Ab groups. (C) The proportion of primary resistance in patients with Amp 11q13 among total patients, patients with the PD-1Ab and patients with nonPD-1Ab. * refer to patients with Amp11q13. (D) Kaplan-Meier estimates of PFS in Amp11q13 and nonAmp11q13 patients in PD-1Ab and Non-PD-1Ab treatment group.

