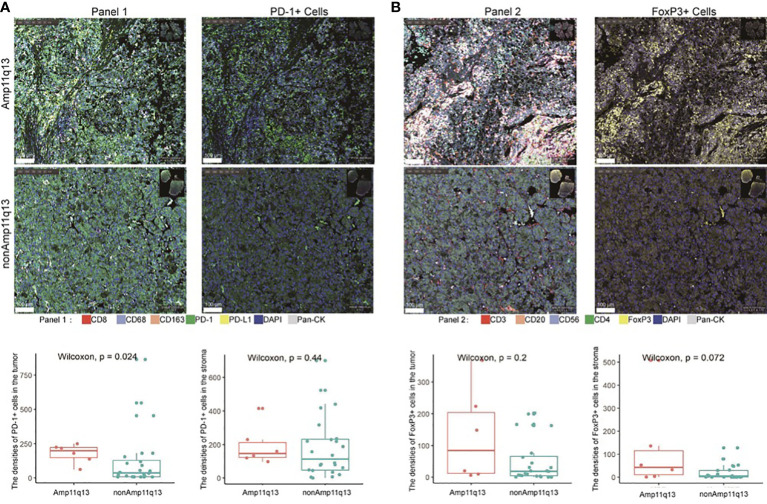
Figure 5.
Relationship between immune cell subsets in tumor immune microenvironment and Amp11q13 status. Images of representative mIHC results (top, scale: 500 μm) were showed in two patients with and without Amp11q13. PD-1+ cells and FoxP3+ cells (bottom) in patients with Amp11q13 compared with nonAmp11q13 patients were also displayed. (A) Panel 1 referred to multiple stained slides and representative merged images show the distribution of individual markers [CD8, CD163, CD68, PD-1, PD-L1, pan-CK, DAPI for nucleic acids (blue)] and the separable vision of immunohistochemical staining with PD-1 antibody (green). (B) Panel 2 referred to multiple stained slides and representative merged images show the distribution of individual markers [CD3, CD20, FoxP3, CD56, CD4, pan-CK, DAPI for nucleic acids (blue)] and the separable vision of immunohistochemical staining with FoxP3 antibody (yellow).

