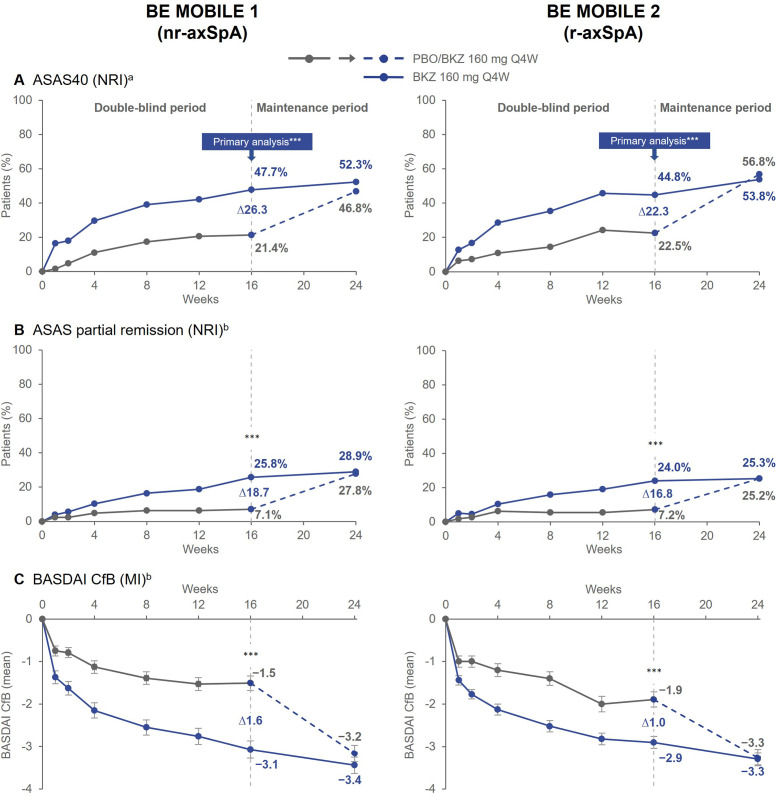
Figure 1.
Key efficacy outcomes over time. Randomised set. aPrimary endpoint; bRanked secondary endpoint. Error bars show SE. All statistical tests were performed at a two-sided alpha level of 0.05. For binary endpoints, p values were calculated by logistic regression with treatment, MRI/CRP classification and region (BE MOBILE 1) or treatment, prior TNFi exposure and region (BE MOBILE 2) as factors. For continuous endpoints, p values were obtained by ANCOVA with treatment, MRI/CRP classification and region (BE MOBILE 1) or treatment, prior TNFi exposure and region (BE MOBILE 2) as fixed effects, and baseline values as covariates. ***p<0.001. ANCOVA, analysis of covariance; ASAS40, Assessment of Spondyloarthritis international Society 40% response; BASDAI, Bath Ankylosing Spondylitis Disease Activity Index; BKZ, bimekizumab; CfB, change from baseline; CRP, C-reactive protein; MI, multiple imputation; nr-axSpA, non-radiographic axial spondyloarthritis; NRI, non-responder imputation; PBO, placebo; Q4W, every 4 weeks; r-axSpA, radiographic axial spondyloarthritis; TNFi, tumour necrosis factor inhibitor.

