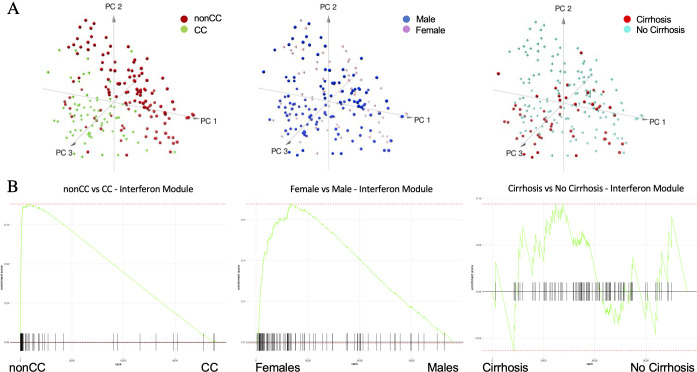
Figure 4.
Principal component analysis (PCA) and preranked gene set enrichment analysis (GSEA) of interferon module genes. (A) Samples’ PCA using as dimension gene expression in interferon module and sample labels colour coded by IFNL4 (interferon lambda 4) genotype (left plot), sex (middle plot) and cirrhotic status (right plot). (B) GSEAs to assess enrichment of interferon module genes (m6) between non-CC versus CC (left plot), female versus male (middle plot) and cirrhosis versus non-cirrhosis (right plot) using genome-wide preranked t-tests after controlling for all covariates.

