
Figure 3.
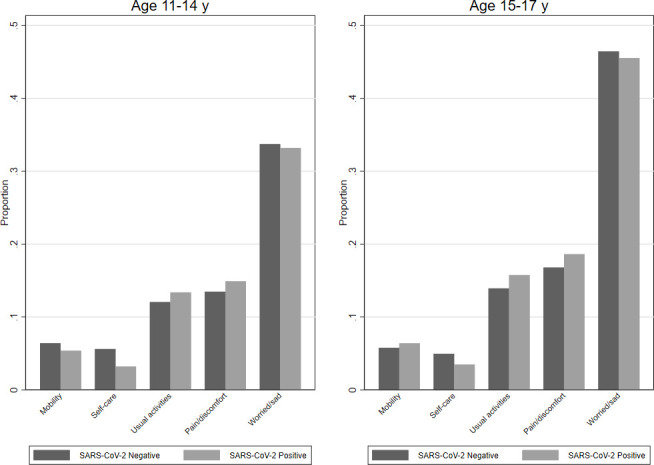
Proportion of participants reporting experiencing some or a lot of problems* 6 months post-test by SARS-CoV-2 status, by age. *Assessed using the five items from the EQ-5D-Y scale, each of which has a three-level response (no problems, some problems, a lot of problems). The graph shows the proportion who experiences some/a lot of problems with mobility, self-care, doing usual activities, having pain/discomfort, or feeling a bit/very worried/sad.