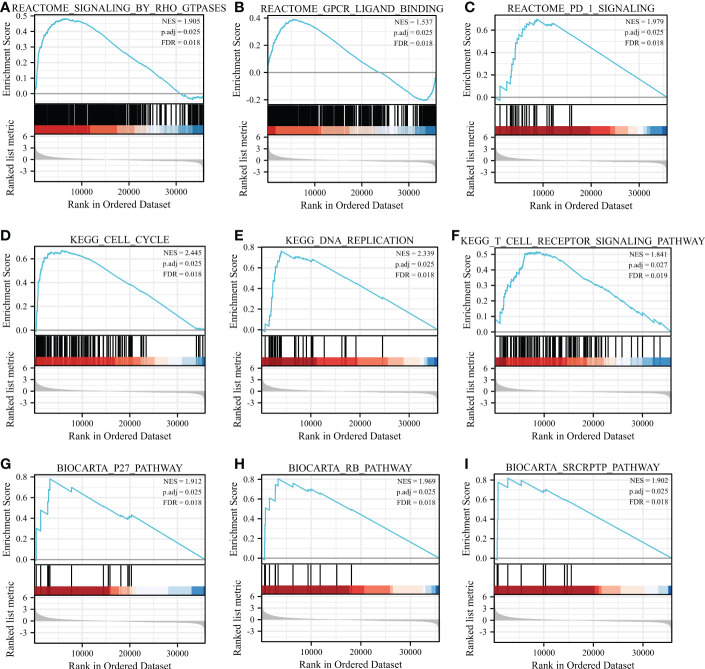
Figure 5.
GSEA enrichment analysis results. GSEA results showed that (A) SIGNALING BY RHO FTPASES, (B) GPCR ligand binding, (C) PD1 signaling, (D) Cell cycle, (E) DNA replication, (F) T cell receptor signaling pathway, (G) P27 pathway, (H) RB pathway, (I) SRCRPTP pathway. FDR, false discovery rate; NES, normalized Enrichment Score.

