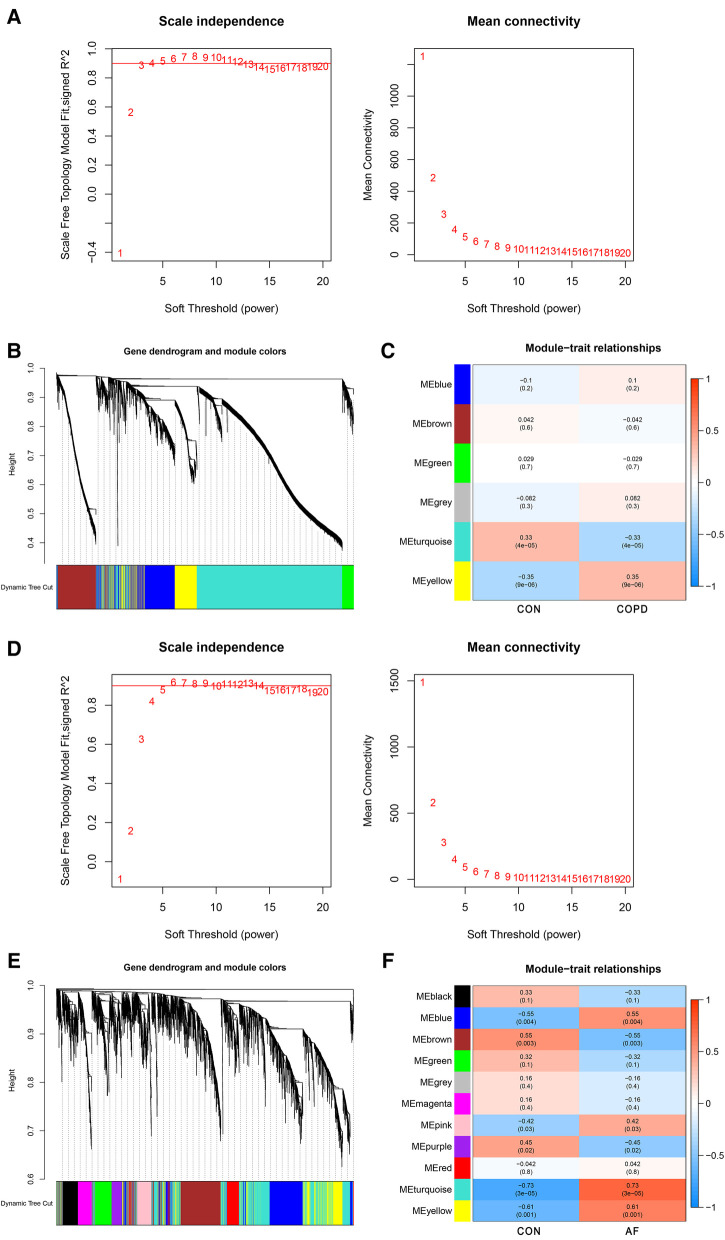
Figure 2.
Identification of COPD and AF module genes via WGCNA. (A) The scale-free fit index for soft-thresholding powers and mean connectivity (GSE76925). (B) Dendrogram of the genes clustered (GSE76925). (C) Module-trait relationships heatmap (GSE76925). The numbers in each cell means the correlation coefficient and p-value. (D) The scale-free fit index for soft-thresholding powers and mean connectivity (GSE79768). (E) Dendrogram of the genes clustered (GSE79768). (F) Module-trait relationships heatmap (GSE79768).

