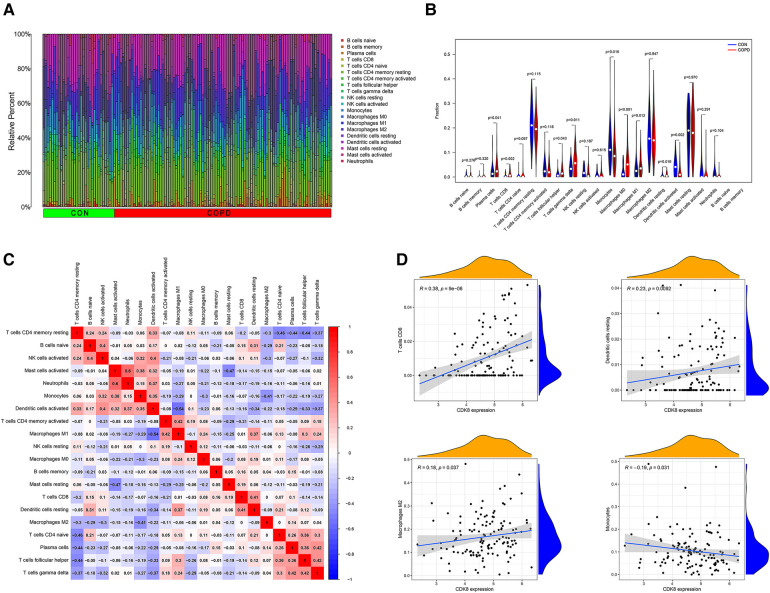
Figure 8.
Immune cell infiltration analysis of GSE76925 and immune cell correlation analysis of CDK8. (A) The proportion of immune cells in different samples. (B) Comparison of immune cell ratios in the COPD and control groups. (C) Heat map of correlation analysis between immune cells. (D) Analysis of the correlation between CDK8 and immune cells.

