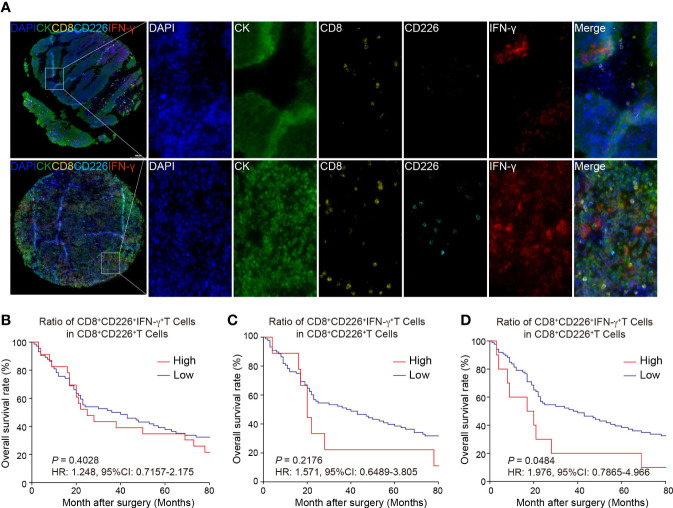
Figure 4.
Multi-colored immunostaining of CD8, CD226, IFN-γ, and the prognostic value of CD226+CD8+IFN-γ+TILs in human GC. (A). Representative images for staining of CD226+CD8+IFN-γ+TILs in GC tissues and normal tissues. (B–D). OS rates stratified by the ratio of CD8+CD226+IFN-γ+TILs in CD8+CD226+TILs in GC tissues (B). whole tissues, (C). epithelial cell region, (D). stromal cell region).

