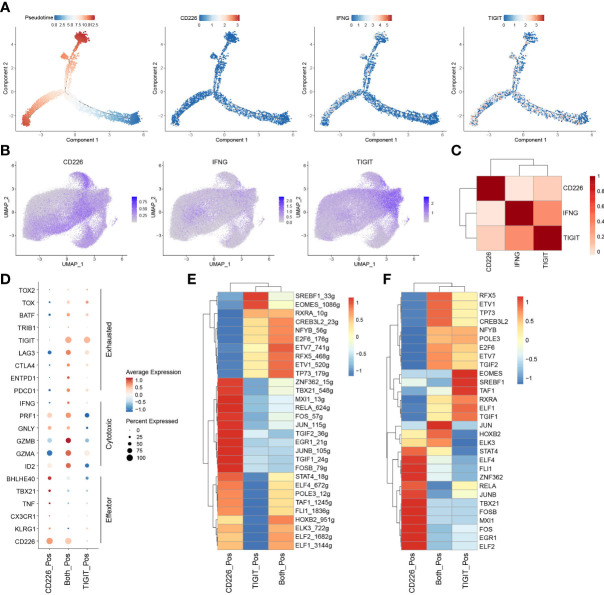
Figure 5.
IFN-γ inhibits the expression of CD226 and promotes T-cell exhaustion. (A) Pseudotime plot of CD8+TILs in ESCA constructed by R package Monocle2. (B) UMAP showed imputed expressions of CD226, IFNG, and TIGIT in all CD8+TILs. (C) Heatmap showed the correlation among CD226, IFNG, and TIGIT in all CD8+TILs. (D) Dot plot showed the expressions of selected genes in CD226+, TIGIT+, and CD226+TIGIT+CD8+TILs. (E) Heatmap showed regulon score of selected transcription factors in CD226+, TIGIT+, and CD226+TIGIT+CD8+TILs. (F) Heatmap showed the expressions of transcription factors (shown in E) in CD226+, TIGIT+, and CD226+TIGIT+CD8+TILs.

