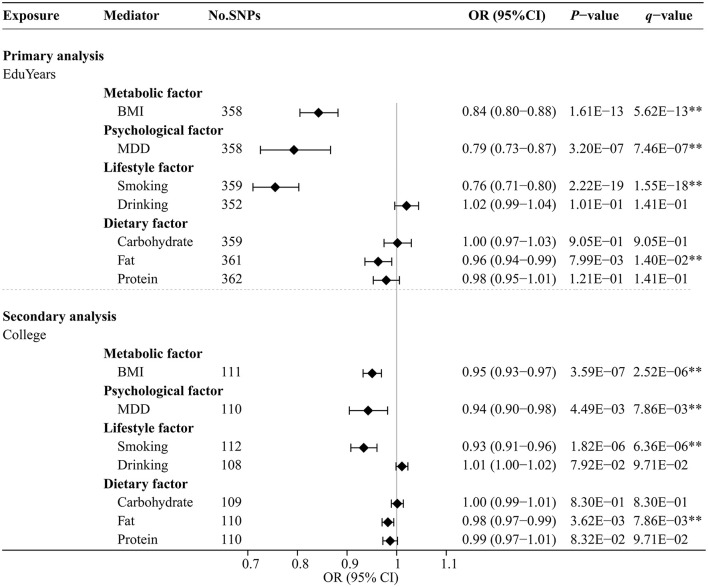
Figure 4.
Univariable MR analysis results of the causal effects of education traits on modifiable risk factors. Odds ratios were per 3.6 years or unit change in modifiable risk factor scaled per genetically predicted SD increase in years of education and per genetically predicted 1-unit-higher log-odds of liability to college completion (per 2.72-fold increase in the rate of college completion). **Indicates significant evidence (q-value < 0.05) after correction for multiple testing estimated by the FDR method.

