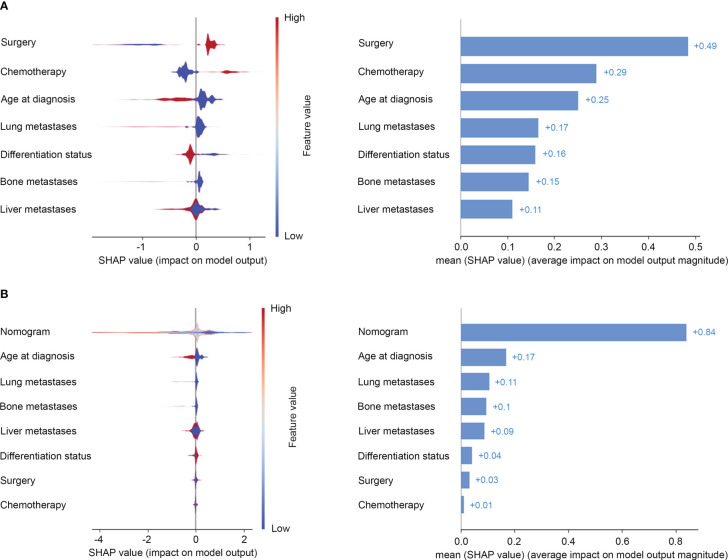
Figure 4.
Risk estimates on clinical-pathologic features (A) and the risk model (B) by Shapley values to predict the risk of all-cause mortality. On the X-axis, the contribution of each feature is shown. A feature with a positive shapley value will favorably impact the prediction (decrease the risk of all-cause mortality). The influence of the value of the feature itself is shown on the Yaxis, for example, for nomogram, a high value (in red) is associated with a positive shapley value that will decrease the risk of all-cause mortality, while a low value (in blue) will increase the shapley value and the risk of all-cause mortality.

