Figure 1.
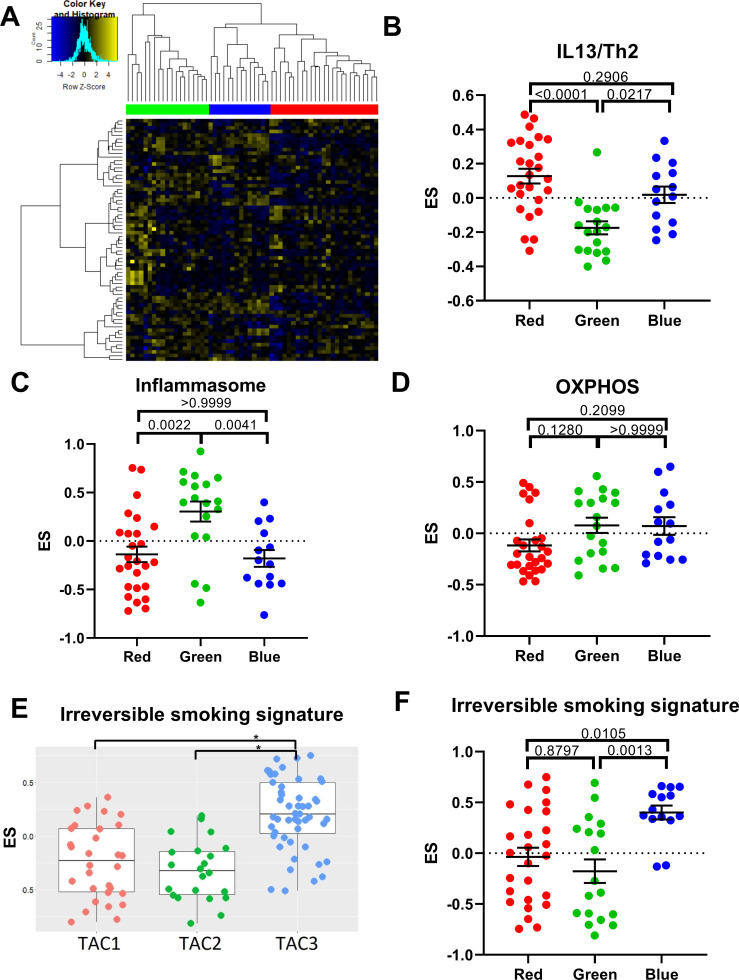
Identification of transcriptome-associated cluster (TAC) signatures in bronchial biopsies. (A) Heatmap of genes that best discriminate each bronchial-derived TAC (TAC) signature (n=58). Columns represent subjects with COPD and rows represent genes. Association of TAC groups 1–3 with gene signatures derived from interleukin (IL)13/T helper (Th)2-stimulated epithelial cells (B), inflammasome activation (C), oxidative phosphorylation (OXPHOS) (D), cigarette smoke irreversibly upregulated signature in sputum samples from U-BIOPRED14 (E) and cigarette smoke irreversibly upregulated signatures in bronchial brushes in Groningen Leiden Universities Corticosteroids in Obstructive Lung Disease TAC groups (F). A one-way analysis of variance was used to compare each TAC group. A Bonferroni adjusted p value <0.05 was considered significant. *P<0.05. ES, enrichment score.

