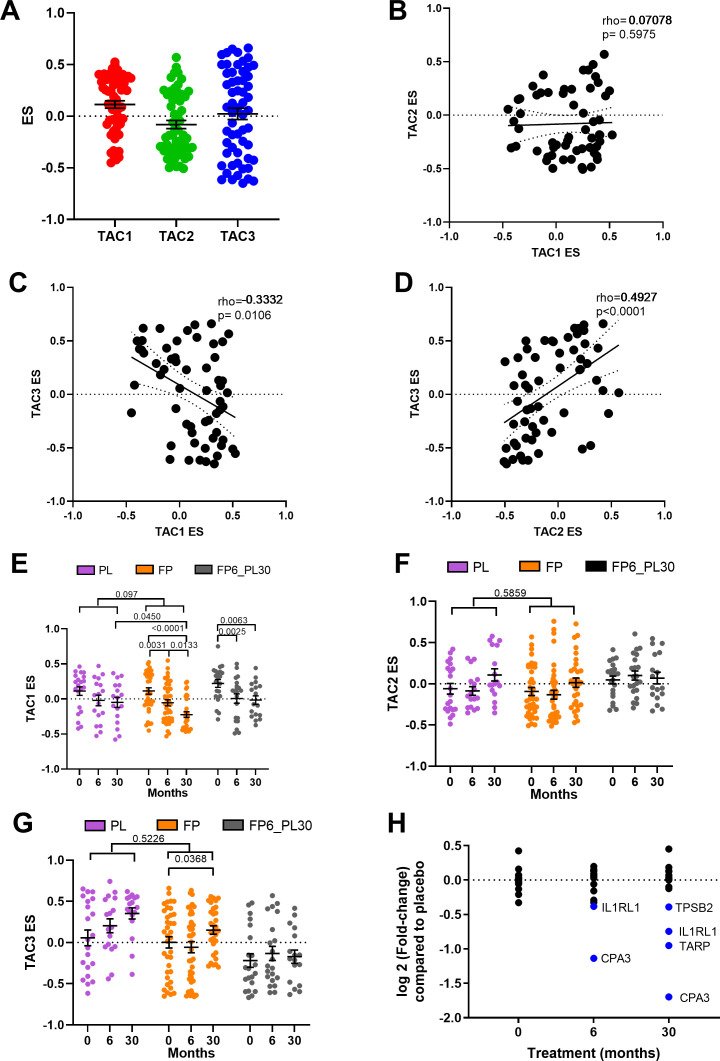
Figure 2.
Relationship between bronchial-derived transcriptome-associated cluster (TAC) signatures and the influence of inhaled corticosteroid (ICS) treatment. (A) Box plot of the expression of TAC signatures across all patients at baseline (median±95% CI). Correlations of the expression signatures between (B) TAC1 and TAC2, (C) TAC1 and TAC3 and (D) TAC2 and TAC3 (n=58). The influence of ICS treatment on (E) TAC1, (F) TAC2 and (G) TAC3. (H) Fold-change of TAC1 genes comparing bronchial expression profiles of treatment arms to time match placebo of the Groningen Leiden Universities Corticosteroids in Obstructive Lung Disease study at baseline, 6 months and 30 months. Blue represents significant downregulated genes (adjusted p value <0.05). Mean±SEM is presented in the figures. For two-way analysis of variance, a Benjamini-Hochberg adjusted p value <0.05 was considered significant. An interaction analysis was conducted on TAC signatures using an LME model investigating the interaction between time and treatment with patient ID as the random factor. ES, enrichment score; FP, fluticasone propionate; FP6_PL30, FP for 6 months and then 24 months with placebo; LME, linear mixed effect; PL, placebo±salmeterol.

