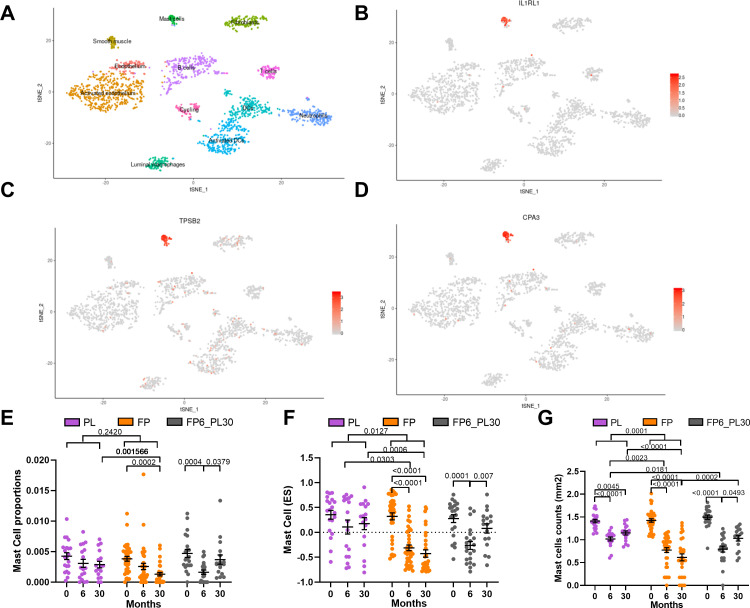
Figure 3.
Determining the basis of inhaled corticosteroids (ICS) sensitivity of the TAC1 signature. tSNE plots for ICS-sensitive TAC1 genes (interleukin 1 receptor like 1 (IL1RL1), tryptase beta-2 (TPSB2) and carboxypeptidase A3 (CPA3)), obtained from of single-cell sequencing data obtained from asthmatic (n=4) and healthy controls (n=4) (A–D). The tSNE plot shows the expression of the selected gene across cell types identified in the single-cell sequencing data with each dot representing a single cell. Panel A highlights the position of each cell type. Analysis of mast cell quantification in bronchial biopsies derived from patients with COPD treated with either placebo, ICS for 6-month then 24-month withdrawal or ICS±long-acting β-agonist (LABA) for 30 months ICS treatment using (E) cellular deconvolution. (F) Gene set variation analysis (GSVA) analysis of a 11 gene mast cell signature derived from single-cell sequencing and (G) histological measurement of log mast cell counts (AA1-positive cells) in bronchial biopsies (mm2). ES, enrichment score; FP, fluticasone propionate±salmeterol; FP6_PL30, FP for 6 months and then 24 months with placebo; PL, placebo. For two-way analysis of variance (ANOVA), a Benjamini-Hochberg adjusted p value <0.05 was considered significant. An interaction analysis was conducted on mast cell signatures using an LME model investigating the interaction between time and treatment with patient ID as the random factor. Mean±SEM is presented in the figures.

