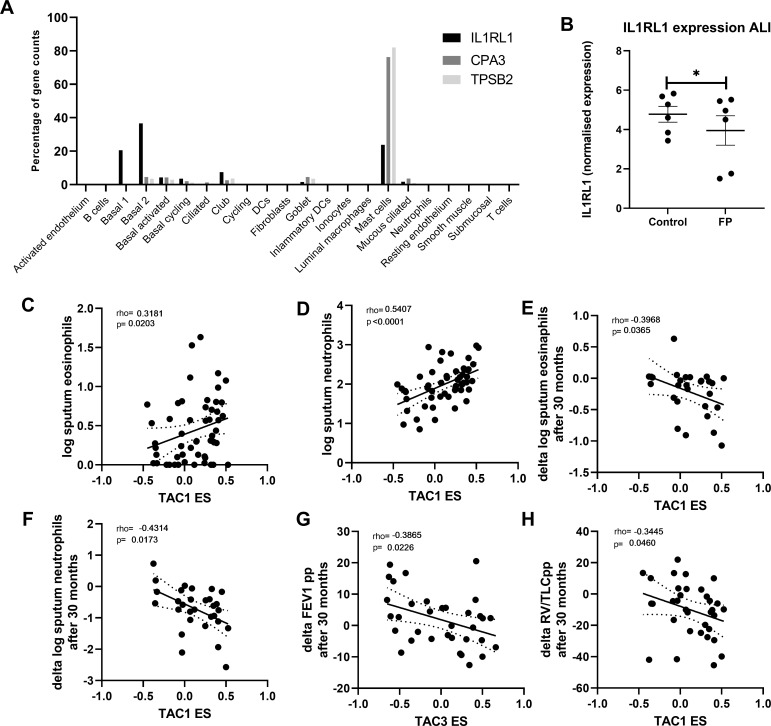
Figure 4.
Correlation of bronchial-derived transcriptome-associated cluster (TAC) signatures and inflammatory cell counts. (A) Expression distribution of interleukin 1 receptor like 1 (IL1RL1), carboxypeptidase A3 (CPA3) and tryptase beta-2 (TPSB2)from single-cell sequencing data from bronchial biopsies (n=8). (B) IL1RL1 expression from primary airway epithelial cells grown at air-liquid interface, quiesced overnight and then treated with fluticasone propionate (FP; 10−8 M) for 24 hours (n=6 donors). Correlation of TAC1 signature at baseline with sputum (C) log eosinophil counts and (D) log neutrophil counts (n=58). Correlation of TAC1 signature at baseline with (E) change in log eosinophil counts and (F) delta log neutrophil counts after 30 months inhaled corticosteroids (ICS)±long-acting β-agonist (LABA). (G) Correlation of TAC3 signature at baseline with delta forced expiratory volume in 1 s (FEV1) %predicted. (H) Correlation of ICS-sensitive TAC1 signature at baseline with delta FEV1 %predicted. ES, enrichment score.

