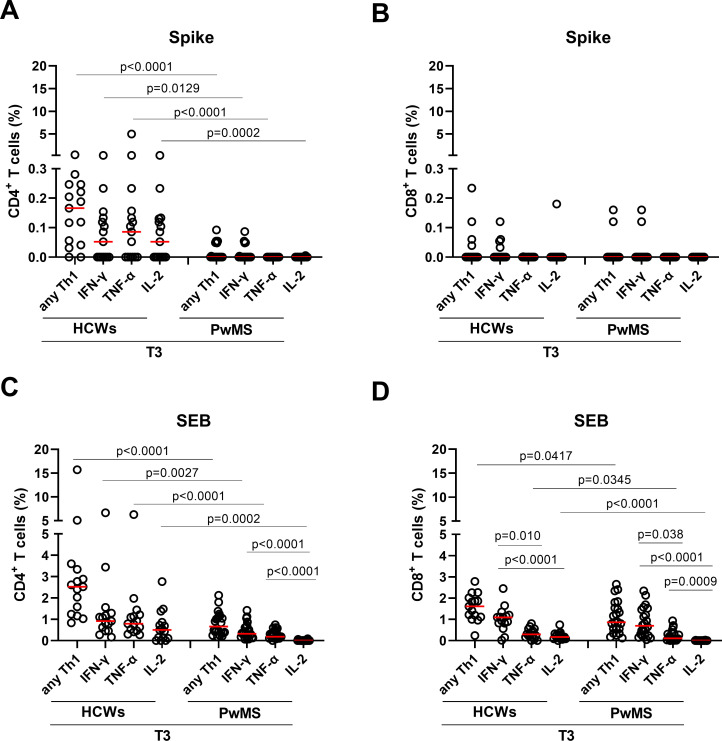
Figure 2.
CD4+ and CD8+ T cell cytokine profiles in response to spike and SEB after the booster dose (T3). (A, B) CD4+ and CD8+ T-cell cytokine responses to spike at T3. Graphs show cytokine production, in terms of total Th1 and single cytokines (IFN-γ, TNF-α and IL-2) in HCWs (n=15) and PwMS (n=22) within the CD4+ (A) and CD8+ (B) T-cell compartments. (C, D) CD4+ and CD8+ T-cell responses to the non-specific stimulus of SEB. Graphs show total Th1 and single cytokine (IFN-γ, TNF-α and IL-2) producing cells in HCWs (n=15) and PwMS (n=22) within the CD4+ (C) and CD8+ (D) T-cell compartments. Frequencies were reported after subtracting the cytokine production of the unstimulated condition. Statistical analysis was performed using Mann-Whitney U test to compare the frequency of the T cells expressing IFN-γ, IL-2 or TNF-α between HCWs and PwMS and Friedman test followed by Dunn’s multiple comparison test for intragroup analyses. P values <0.05 were considered significant. Red lines indicate medians and each dot represents a different HCW or PwMS. HCWs, healthcare workers; IFN-γ, interferon gamma; IFN-β, interferon beta; PwMS, patients with multiple sclerosis; SEB, staphylococcal enterotoxin B.

