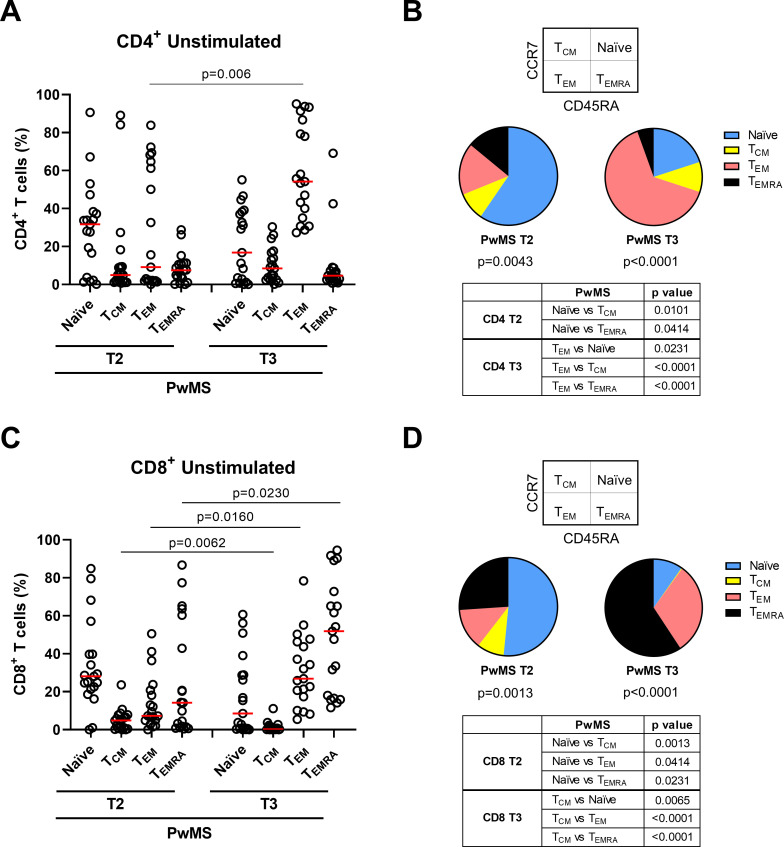
Figure 5.
Over time evolution of memory T-cell phenotypes in CD4+ and CD8+ T cells. (A–D) T-cell phenotype in PwMS (n=19) longitudinally sampled after 6 months from the first vaccine dose (T2) and after 4–6 weeks from the booster dose (T3) in unstimulated condition. Frequency of CD4+ (A) and CD8+ T cells (C) gated according to CD45RA and CCR7 expression. Pie charts show the proportion of CD4+ (B) and CD8+ (D) T-cell subpopulations at both time points. Statistical analyses were performed using Wilcoxon matched pairs signed rank test and p values <0.05 were considered significant. Friedman test followed by Dunn’s multiple comparison test was used for pie charts analyses and pie graphs were generated using the median frequency. Red lines indicate the medians. Each dot represents a different PwMS. PwMS, patients with multiple sclerosis; TCM, central memory; TEM, effector memory; TEMRA, terminally differentiated effector memory.

