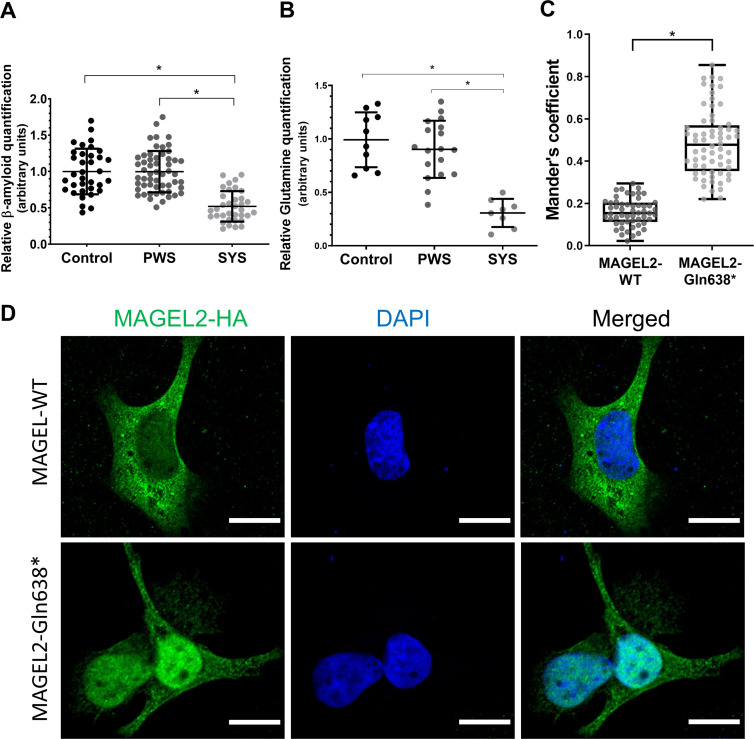
Figure 3.
Molecular and cellular biomarkers for Schaaf-Yang syndrome (SYS). (A) Amyloid-β 1–40 (Aβ1-40) peptide levels in control, Prader-Willi syndrome (PWS) and SYS fibroblasts’ extracellular medium. Data obtained from at least three independent experiments (SYS: n=5; PWS: n=9; control: n=5). (B) Glutamine levels in control, PWS and SYS fibroblasts (SYS: n=6; PWS: n=9; control: n=6). Values from two independent experiments have been normalised to the mean of the control group. Horizontal lines represent mean values and error bars represent the SD. Statistical analyses were performed using one-way analysis of variance and Tukey’s multiple comparisons test in GraphPad Prism. *p<0.001. (C) Colocalisation quantification using Mander’s coefficient between the haemagglutinin (HA) fluorescence signal and DAPI (4′,6-diamidino-2-phenylindole) in MAGEL2-wild-type (WT) and MAGEL2-Gln638* transfected cells normalised by the total HA intensity. n=118 from six independent experiments. *p<0.001. (D) Representative immunofluorescence images of SAOS-2 cells transfected with MAGEL2-WT and MAGEL2-Gln638* plasmids, stained with anti-HA (green, tagging MAGEL2) or DAPI (blue, cell nuclei). Scale bar represents 15 µm.

