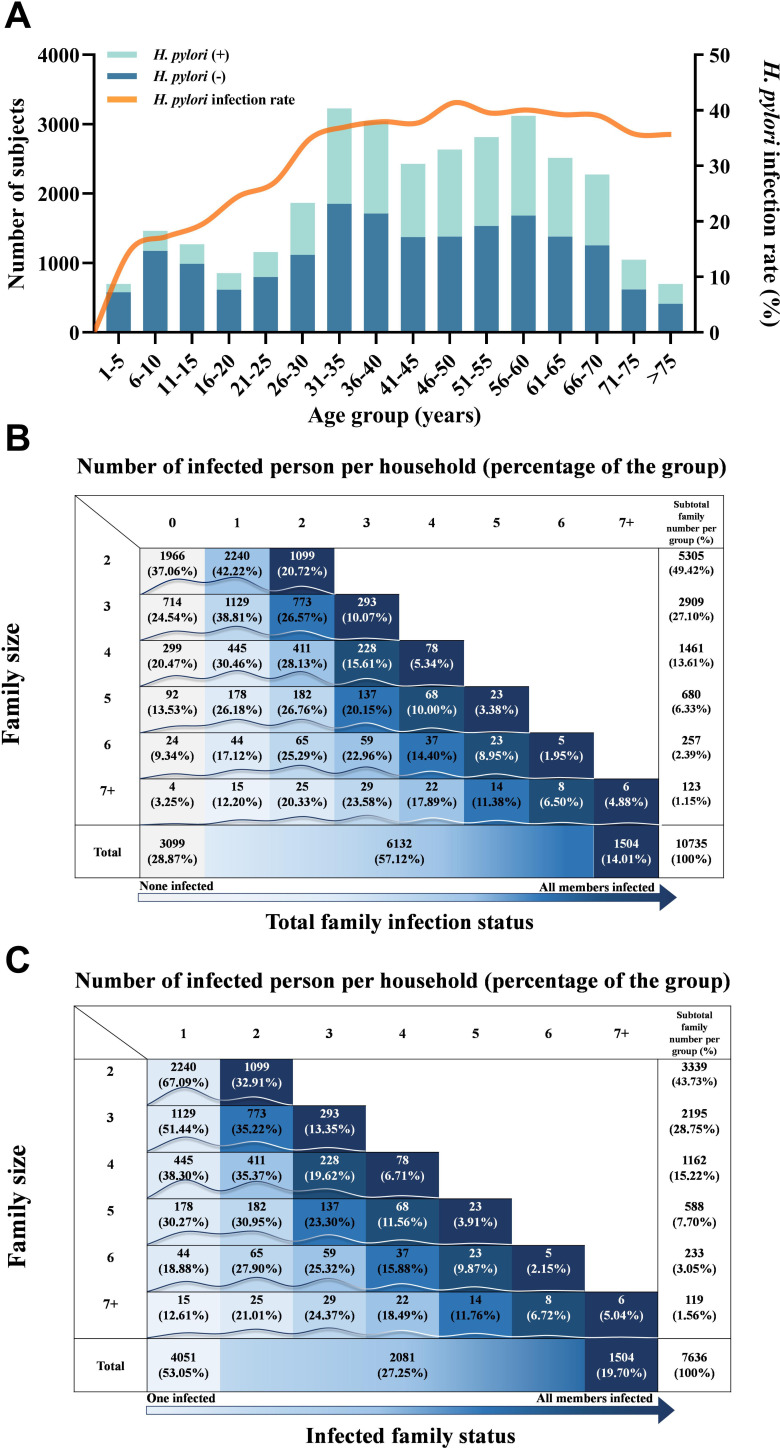
Figure 2.
Helicobacter pylori infection status of the enrolled families. (A) H. pylori infection status of enrolled participants and their infection rates in different age groups. Left y axis represents the number of participants enrolled, and right y axis represents the percentage of their infection rates, x axis indicates different age groups. (B, C) figure 2B indicates H. pylori infection status of 10 735 enrolled families, and figure 2C indicates stratified 7636 H. pylori-infected families. y axis represents family size, which ranges from 2 to 7 (or more) persons, and x axis represents the number of infected persons within the household. Numbers within square represents the number of infected families; percentage numbers within the bracket and curve lines indicate the percentage of infected families in the same family size groups. Infected family: at least one person in the family was infected; non-infected family: all members in the family were not infected. Children: participant’s age is less than 18 years for short, including children and adolescents.

