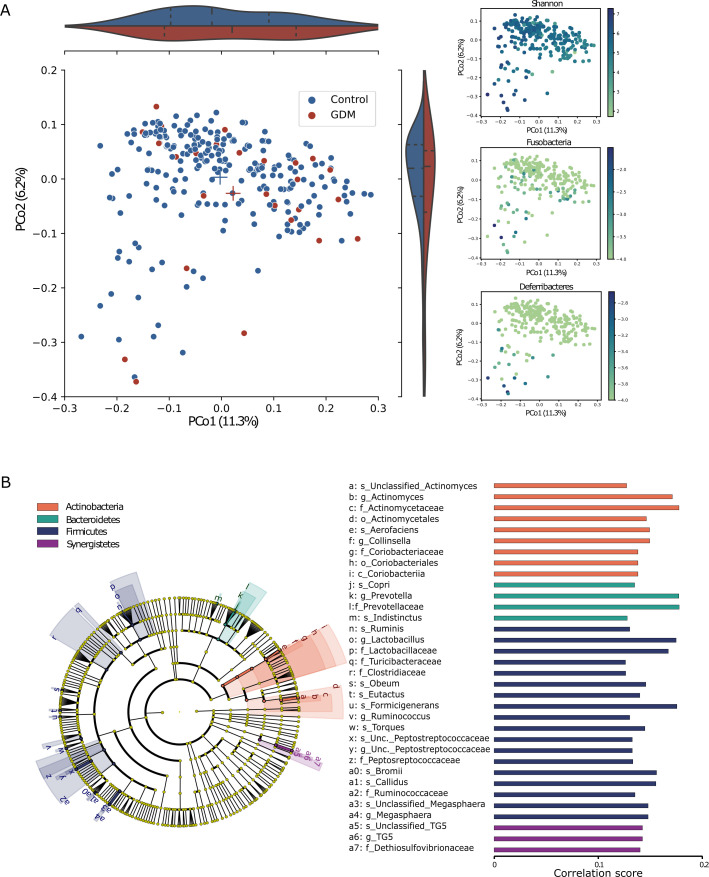
Figure 2.
Differences in faecal microbiome composition in first trimester between women who would and would not develop GDM later. (A) Principal coordinate analysis based on 16S rRNA gene sequence profiling of the microbiome (GDM: n=28, control: n=236) using the unweighted UniFrac dissimilarity metric coloured by GDM/control (left; p=0.06, PERMANOVA); violin plots represent the distribution of GDM/control on each axis; Shannon diversity (top right; R2=0.24 with PCo1) and two phyla that mostly explain the PCo1 and PCo2 variance: Fusobacteria (R2=0.08 with PCo2) and Deferribacteres (R2=0.3 with PCo2). (B) The cladogram represents the microbial features associated with the disease state, while controlling for the main risk factors, BMI and age, at all taxonomic ranks. Spearman’s rank correlation for each association: a positive association (all associations found), implies over-represented features in the healthy control group. Cladogram and bars are coloured by phylum. BMI, body mass index; GDM, gestational diabetes mellitus; Unc., unclassified; PERMANOVA, permutational multivariate analysis of variance.

