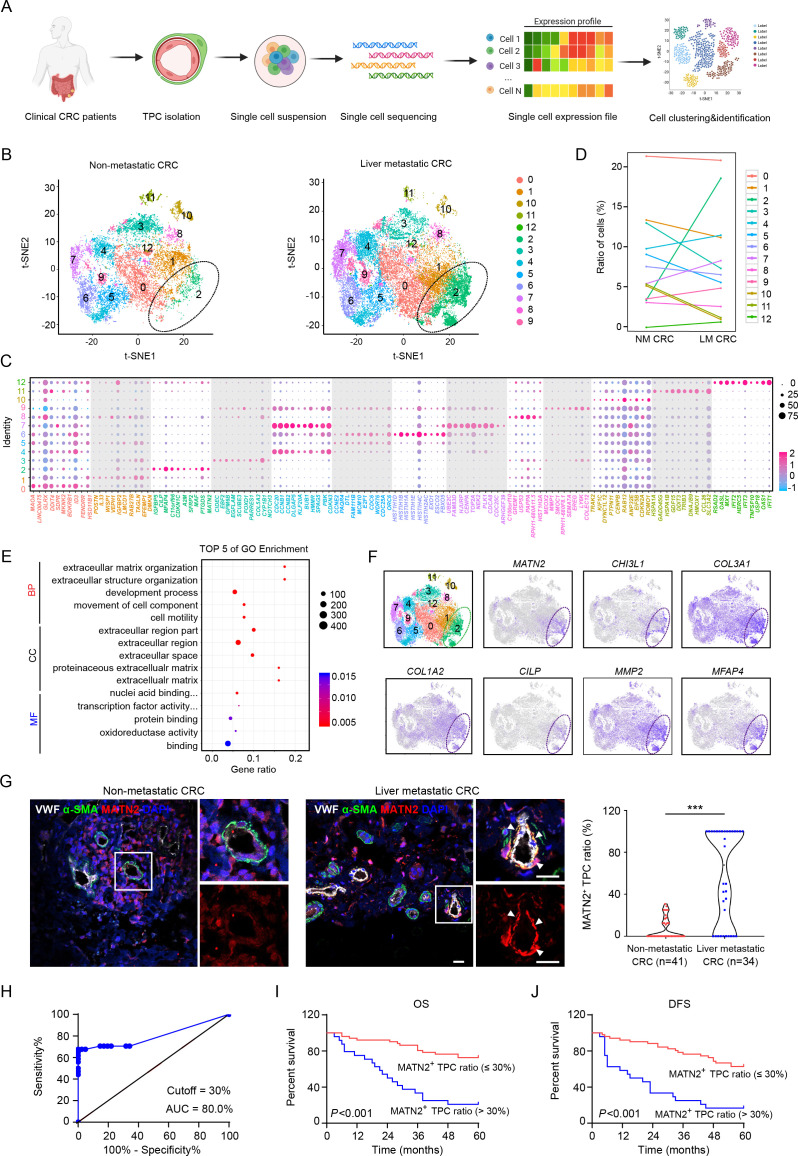
Figure 1.
Transcriptomic characterisation of matrix-pericytes in TPCs derived from CRC patients. (A) Schematic diagram of scRNA-seq for TPCs. (B) t-SNE visualisation of TPC subsets derived from primary tumour tissues of CRC patients with (n=2) or without (n=2) liver metastasis. (C) Dot plots of the top ten marker genes in each TPC subset. (D) Percentage of each subset of TPCs. (E) GO analysis of the upregulated genes in cluster 2. (F) t-SNE visualisation of TPCs at all stages is combined, overlaid with the expression of indicated genes. (G) Immunofluorescence analysis and quantification of MATN2+ matrix-pericyte ratio in primary tumour tissues from CRC patients with (n=34) or without (n=41) liver metastasis. white arrows indicate the staining of MATN2 in TPCs. scale bar, 20 µm. each sample on the violin plots represents individual patient data. ***P < 0.001 by two-tailed Mann-Whitney test. (H) ROC curve analysis of MATN2+ TPC ratio in CRC patients (n=75). (I, J) Kaplan-Meier analysis of the OS (I) or DFS (J) in CRC patients with high or low MATN2+ matrix-pericyte ratio (based on 30% cut-off, n=75). P<0.001 by Log-rank (Mantel-Cox) test. BP, biological process; CC, cellular component; CRC, colorectal cancer; DAPI, 4',6-diamidino-2-phenylindole; DFS, disease-free survival; GO, Gene Ontology; LM CRC, liver metastatic colorectal cancer; MF, molecular function; NM CRC, non-metastatic colorectal cancer; OS, overall survival; ROC, receiver operating characteristic; TPC, tumour pericyte; t-SNE, t-stochastic neighbour embedding; VWF, von willebrand factor.

