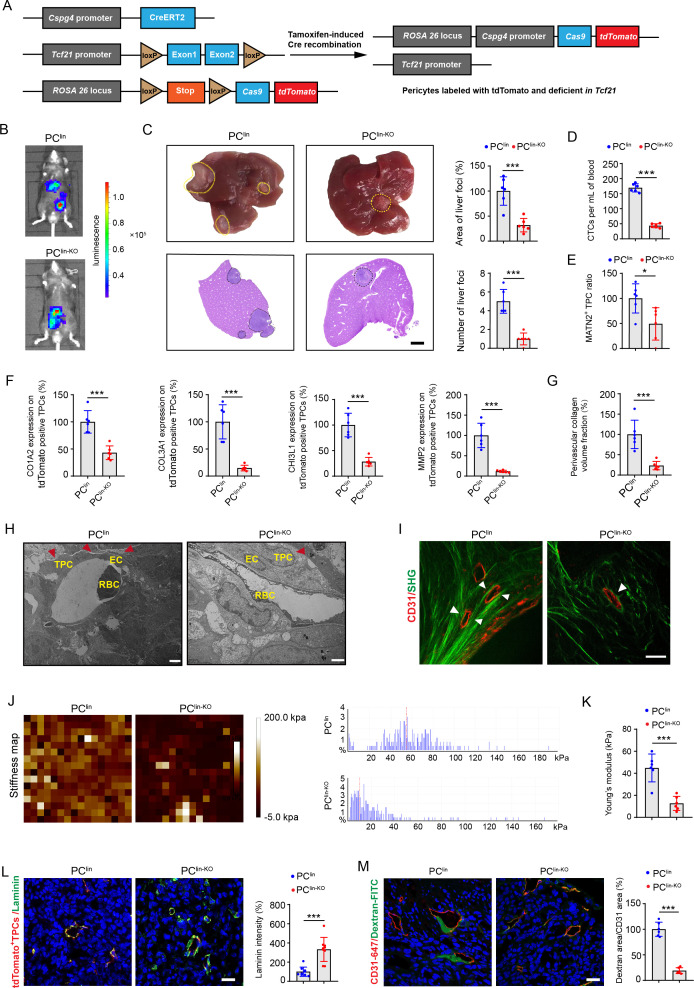
Figure 4.
Pericyte-specific knockout of Tcf21 inhibits the remodelling of perivascular ECM and CRC metastasis. (A) schematic diagram of the construction of Cspg4 (NG2) lineage-tracing Tcf21 inducible knockout mice. (B) Representative images and quantification of bioluminescence signals of mice orthotopically injected with MC38-luc-LM3 cells (n=6). (C) Representative images and H&E analysis of livers derived from MC38-luc-LM3 xenograft-bearing mice (n=6). Yellow and black dotted lines indicate the liver metastatic loci. Scale bar, 2 mm. (D) Quantification of CTCs (n=6). (E) Quantification of MATN2+ TPC ratio in primary tumour sections (n=6). (F) Quantification of the expression of COL3A1, MMP2, COL1A1 and CHI3L1 on TPCs (tdTomato) in primary tumour sections (n=6). (G) Quantification of perivascular collagen in primary tumour sections (n=6). (H) Representative TEM images of collagen fibres surrounding TPCs (n=6). Red arrowheads indicate the perivascular collagen fibres. Scale bar, 2 µm. (I) Representative images of perivascular collagen organisation in tumours imaged by SHG (green) and CD31 (red) (n=6). White arrowheads indicate the perivascular collagen fibres. Scale bar, 50 µm. (J, K) Representative AFM images and quantification of the stiffness of the perivascular area in primary tumour sections (n=6). (L) Immunofluorescence staining and quantification of laminin (green) surrounding TPCs (tdTomato) in primary tumour sections (n=6). Scale bar, 20 µm. (M) Immunofluorescence staining and quantification of FITC–dextran 40 kD (green) surrounding vessels labelled with CD31 in primary tumour sections (n=6). Scale bar, 20 µm. Data are presented as mean±SEM. *P< 0.05, ***P <0.001 by two-tailed unpaired t-test. AFM, atomic force microscopy; CRC, colorectal cancer; CTC, circulating tumour cell; EC, endothelial cell; ECM, extracellular matrix; RBC, red blood cell; SHG, second-harmonic generation; TEM, transmission electron microscopy; TPC, tumour pericyte.

