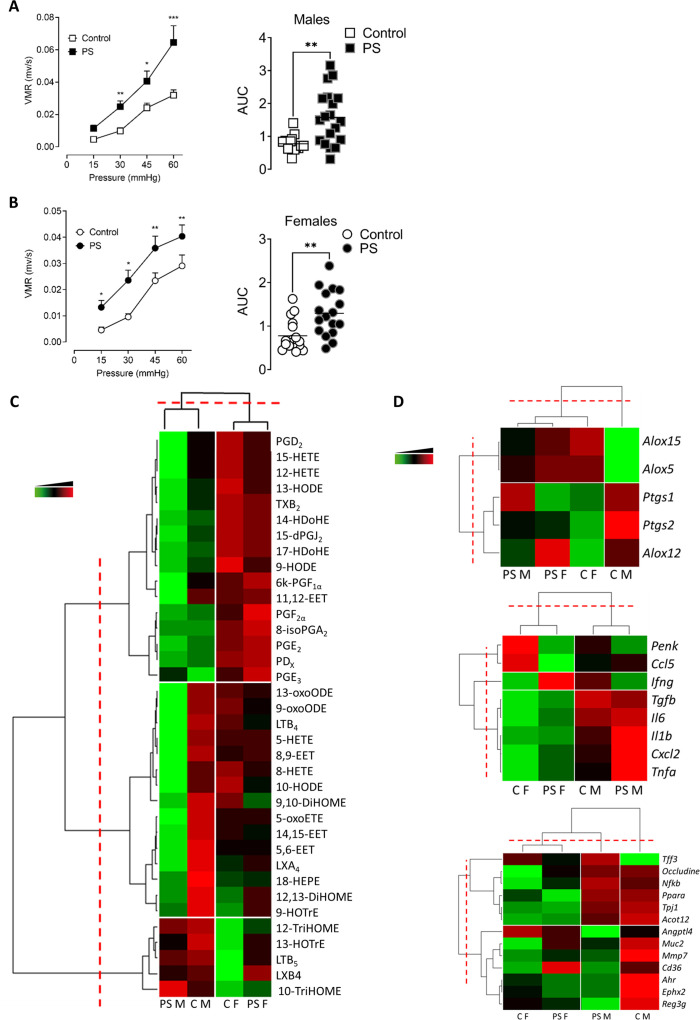
Figure 1.
PS induces visceral hypersensitivity in the adult offspring. VMR to colorectal distensions in control (white) or PS (black) mice in response to increasing pressures of distension (15, 30, 45 and 60 mm Hg) was measured in both male (A) and female (B) offspring. Data are expressed as mean±SEM (n=14–19 mice/group, three independent experiments). Statistical analysis was performed using two-way analysis of variance and subsequent Sidak multiple comparison test. *P<0.05, **P<0.01, ***P<0.001 significantly different from the control group. The results are also expressed as AUC presented as scatter dot plot with the mean. Statistical analysis was performed using a Mann-Whitney test. **P<0.01, significantly different from the control group. (C) Heat map of PUFA metabolites quantified by liquid chromatography coupled to mass spectrometry. Data are shown in a matrix format: each row represents a single PUFA metabolite, and each column represents a group of mice: C M=control males, PS M=PS males, C F=control females, PS F=PS females. each colour patch represents the normalised quantity of PUFA metabolites (row) in a group of mice (column), with a continuum of quantity from bright green (lowest) to bright red (highest). The pattern and length of the branches in the dendrogram on the left, reflect the relatedness of the PUFA metabolites, on top the relatedness of the mouse groups. The dashed red line is the dendrogram distance used to cluster PUFA metabolites and mouse groups. (n=15 mice/group, 2 independent experiments). (D) Heatmap of mRNA expression of genes coding for enzymes implicated in PUFA metabolism (top panel), colonic immune response (middle panel) and gut homeostasis (bottom panel). Data are shown in a matrix format: each row represents a single PUFA metabolite, and each column represents a group of mice: CM, CF, PSM and PSF. Each colour patch represents the normalised gene expression (row) in a group of mice (column), with a continuum of quantity from bright green (lowest) to bright red (highest). The pattern and length of the branches in the dendrogram on the left reflect the relatedness of the gene expression on top the relatedness of the mouse groups. The dashed red line is the dendrogram distance used to cluster genes and mouse groups (n=15 mice/group, three independent experiments). AUC, area under the curve; CF, control female; CM, control male; PS, prenatal stress; PSF, prenatal stress male female; PSM, prenatal stress male; PUFA, polyunsaturated fatty acid; VMR, visceromotor response.

