Figure 7.
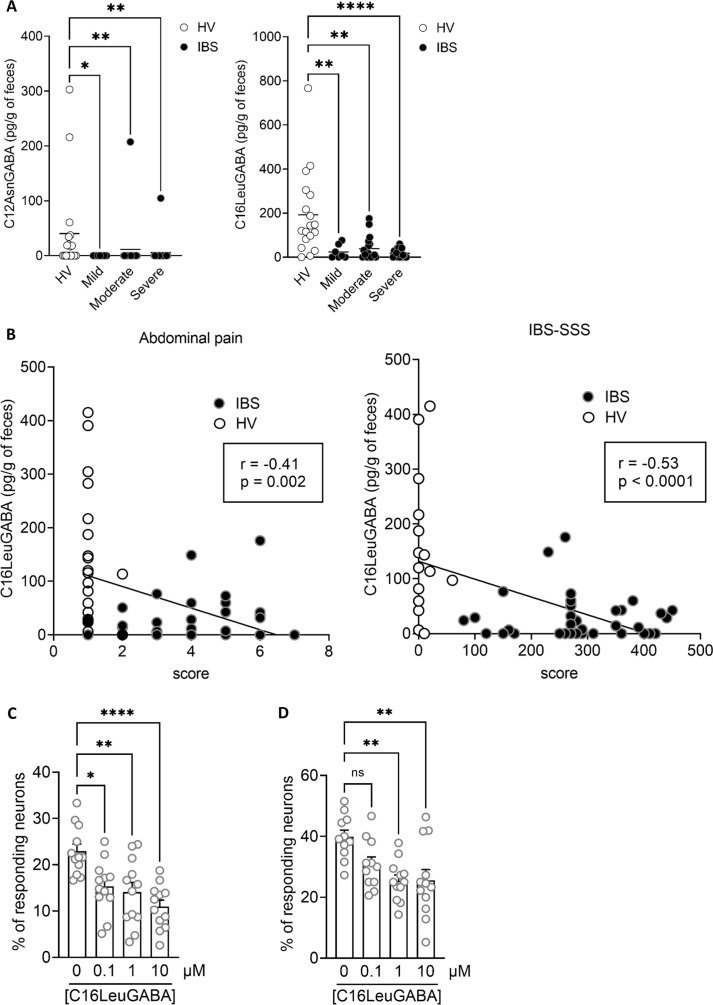
Lipopeptide–GABA concentrations are decreased in the faeces of patients with IBS. (A) 16LeuGABA (left panel) and C12AsnGABA (right panel) concentrations quantified by liquid chromatography–tandem mass spectrometry; in the faeces of HVs (n=18, white) and patients with IBS (black) with an IBS-SSS corresponding to mild (n=7), moderate (n=18) or severe (n=18) IBS. Data are expressed as scatter dot plots with the mean. Statistical analysis was performed using Kruskal-Wallis analysis of variance and subsequent Dunn multiple comparison test. **P<0.01, **P<0.001 significantly different from HVs. (B) Spearman correlations were used to analyse the correlation between the concentration of CL16LeuGABA and abdominal pain score (left panel) or IBS-SSS (right panel) in HVs (white) and patients with IBS (black). P and R values are indicated on each graph. (C) Percentage of responding neurons pretreated with increasing amounts of C16LeuGABA or vehicle (HBSS/MeOH 0.06%, 0 µM) and treated with capsaicin (500 nM) or (D) a mix of GPCR agonists (histamine, serotonin and bradykinin, 10 µM each). Data are represented as mean±SEM; n=4 independent experiments of two to three wells per condition and 20–50 neurons per well. Statistical analysis was performed using Kruskal–Wallis analysis of variance and subsequent Dunn post hoc test. *P<0.05, **P<0.01, ****P<0.0001 significantly different from capsaicin or GPCR mix. GPCR, G protein-coupled receptor; IBS-SSS, IBS Severity Scoring System; ns, not significant; HV, healthy volunteer.

