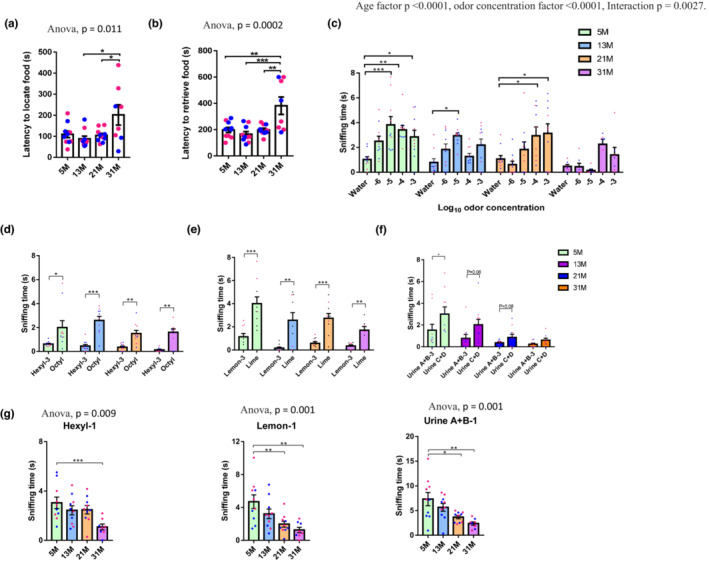
FIGURE 1.

Aged mice show deficits in odor detection, sensitivity, and discrimination. (a, b) Time to locate (a) and retrieve food (b) in the buried food test. One‐way ANOVA followed by Tukey's multiple comparisons test was applied for statistical analysis. N = 8–10 mice per group. (c) Odor sensitivity test. Two‐way ANOVA followed by Turkey's multiple comparison test was applied for multiple comparison. The average sniffing time on the last two presentations of water are plotted. N = 7–10 mice per group. (d–f) Discrimination of similar odor pairs in the habituation–dishabituation task. Paired t tests (two‐tailed) were performed to compare the sniffing time between the third presentation of odor A (A‐3) and subsequent presentation of odor B. Odor pairs include hexyl acetate and octyl acetate (d), lemon and lime extracts (e) and mouse urine pools (f). N = 8–10 mice per group. (g) Time investigating novel odorants. One‐way ANOVA was applied for statistical analysis. N = 8–10 mice per group. Blue and red dots, respectively, represent male and female mice for all graphs. Values are mean and SEM, *p < 0.05; **p < 0.01; ***p < 0.001.
