FIGURE 5.

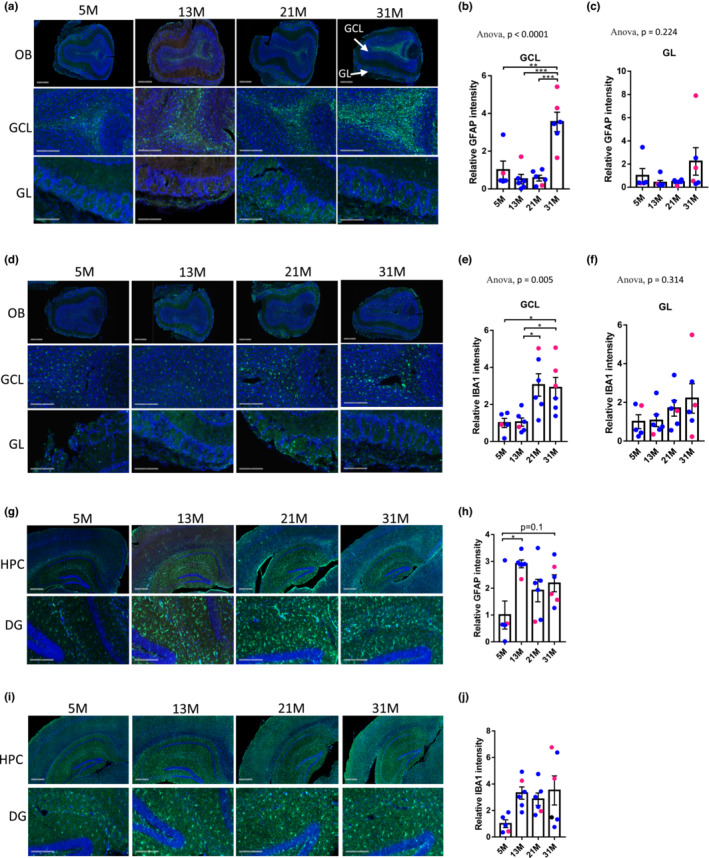
Expression of GFAP and IBA1 are increased with aging in OB tissue. (a) Representative images of GFAP (green) and DAPI (blue) staining in OB from different age groups. (scale bars: 500 μm in images from the first row, 200 μm in the second and third rows). (b, c) Quantification of GFAP signal in GCL (b) and GL (c) layers of OB. (d) Representative images of IBA1 (green) and DAPI (blue) staining in OB from different age groups (scale bars: 500 μm in images from the first row, 200 μm in the second and third rows). (e, f) Quantification of relative IBA1 signal in GCL (e) and GL (f) layers of OB. (g) Representative images of GFAP (green) and DAPI (blue) staining in HPC and DG (dentate gyrus) from different age groups (scale bars: 500 μm in images from the first row, 200 μm in the second row). (h) Quantification of relative GFAP signal in HPC from different age groups. (i) Representative images of IBA1 (green) and DAPI (blue) staining in HPC and DG from different age groups (scale bars: 500 μm in images from the first row, 200 μm in the second row). (j) Quantification of relative IBA1 signal in HPC from different age groups. For all graphs, N = 5–6 mice per group; blue and red dots represent male and female mice, respectively; one‐way ANOVA followed by Tukey's multiple comparisons test was applied for statistical analysis. Values are mean and SEM. *p < 0.05; **p < 0.01; ***p<0.001.
