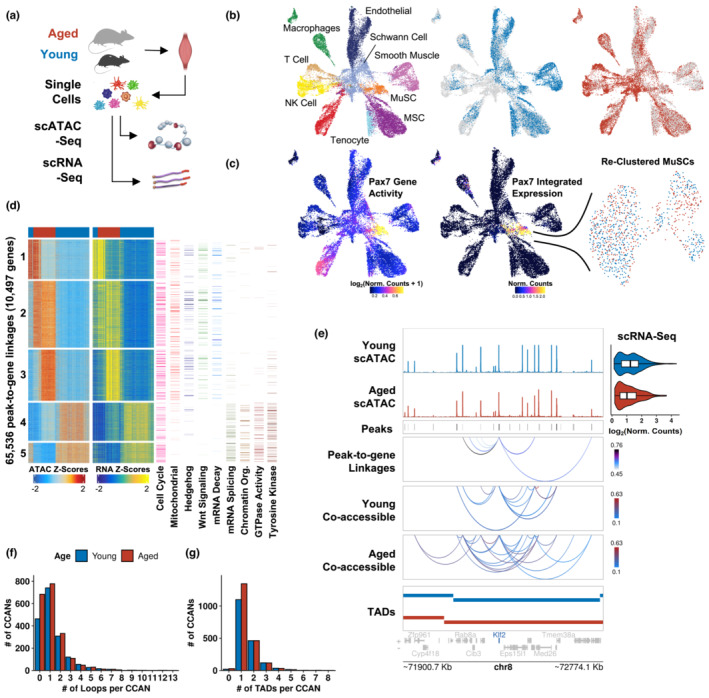
FIGURE 3.

Single‐cell multi‐omic analysis of gene regulatory dynamics during muscle stem cell aging. (a) Schematic of single‐cell ATAC‐seq (scATAC‐seq) dataset generation and integration with single‐cell RNA‐seq (scRNA‐seq) datasets. (b) scATAC UMAP embeddings colored by cell type and age. (c) scATAC UMAP embeddings colored by Pax7 gene activity scores and linked gene expression from integrated scRNA datasets. The identified MuSC cluster was reclustered and colored by age. (d) Row‐scaled heatmaps of statistically significant peak‐to‐gene linkages. Each row represents either chromatin accessibility at a distal site (left) or expression of the target gene (right). The columns represent cell aggregates colored by age. K‐means clustering (5 clusters) reveals distinct regulatory networks between young and aged MuSCs. Heatmaps of representative Reactome pathways enriched in each cluster are shown to the right. (e) scATAC signal tracks, peaks, and peak‐to‐gene linkages for Hes1 colored by correlation scores. Cis‐co‐accessibility of distal sites involved in these linkages are shown below colored by co‐accessibility scores. TADs encompassing the locus are shown at the bottom. Expression from integrated single cell RNA datasets are shown as violin plots. (f) and (g) Histograms of the number of CCANs constrained within individual (f) loops and (g) TADs.
