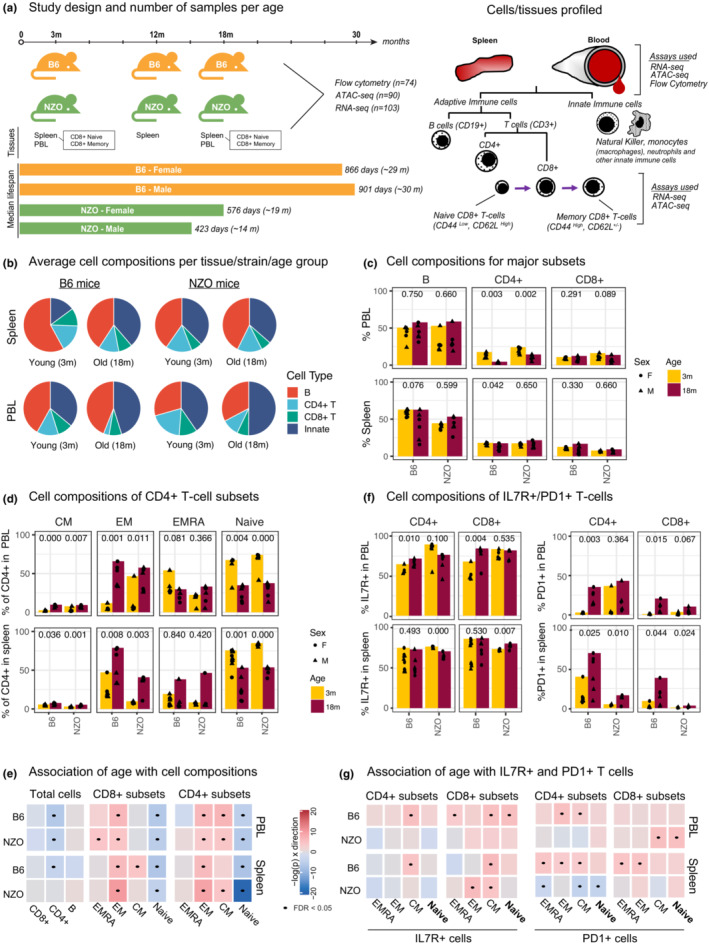
FIGURE 1.

(a) Schematic of study design. PBL and spleen were collected from 3‐ and 18‐month‐old mice, and CD8+ T cells were sorted from spleen. We also collected and profiled spleen from 12‐month‐old mice. From these samples, ATAC‐seq, RNA‐seq, and flow cytometry data were generated. Right panel: markers used for sorting/staining in our study. (b) Overall cell composition pie charts for PBL and spleen from young and old mice for B, CD4+ T, and CD8+ T cells. The remaining cells were designated as “innate.” (c) Changes in the cellular composition of major cell types in mouse spleen and PBL with age (x‐axis represents age in months, and each dot represents an animal). The jitter around points is for plotting purposes to avoid overlapping dots. (d) Similar to (c) for CD4+ T‐cell subsets (CM: Central Memory, EM: Effector Memory, EMRA: Effector Memory re‐expressing CD45RA). (e) Summary for the association of age with a given cell type using linear models. Each cell type was colored according to the slope of change per unit of age (in months) and the direction of the slope—red for positive (increase with age) and blue for negative (decrease with age) slopes, with darker colors indicating steeper slope (i.e., more significant changes). Significant associations (FDR 5%) are marked with a dot. (f) Cell composition changes of IL7R+ and PD1+ T‐cell subsets. (g) Linear models that associate IL7R+ and PD1+ T‐cell percentages to age similar to (e). p‐values in c‐d‐f are calculated using unpaired t‐test.
