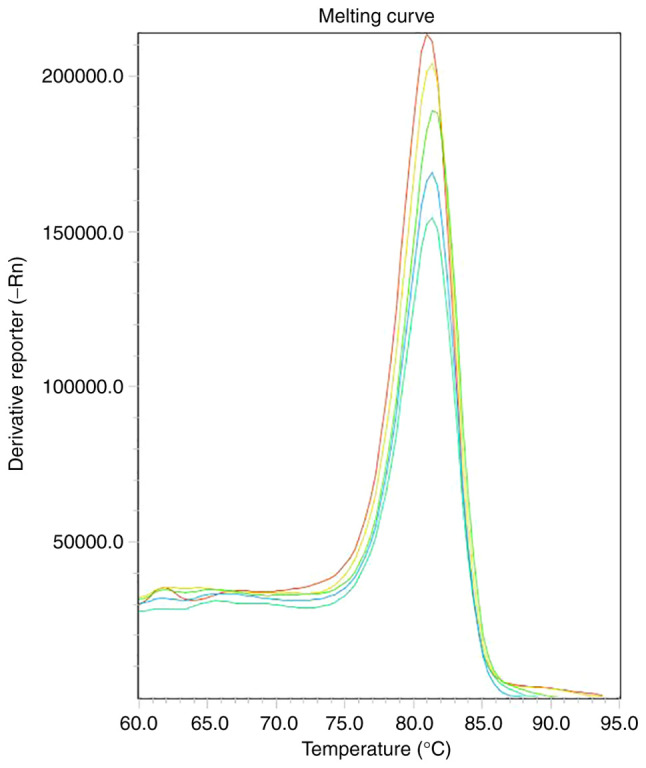
Figure 3.

Schematic representation of high-resolution melting. Based on the principle that different shapes of melting curves are formed by different melting temperatures of single nucleotides, the specific dsDNA fluorescent dye is used to generate different shapes of melting curves to detect the samples. The different colored lines represent the high-resolution melting curves of different samples.
