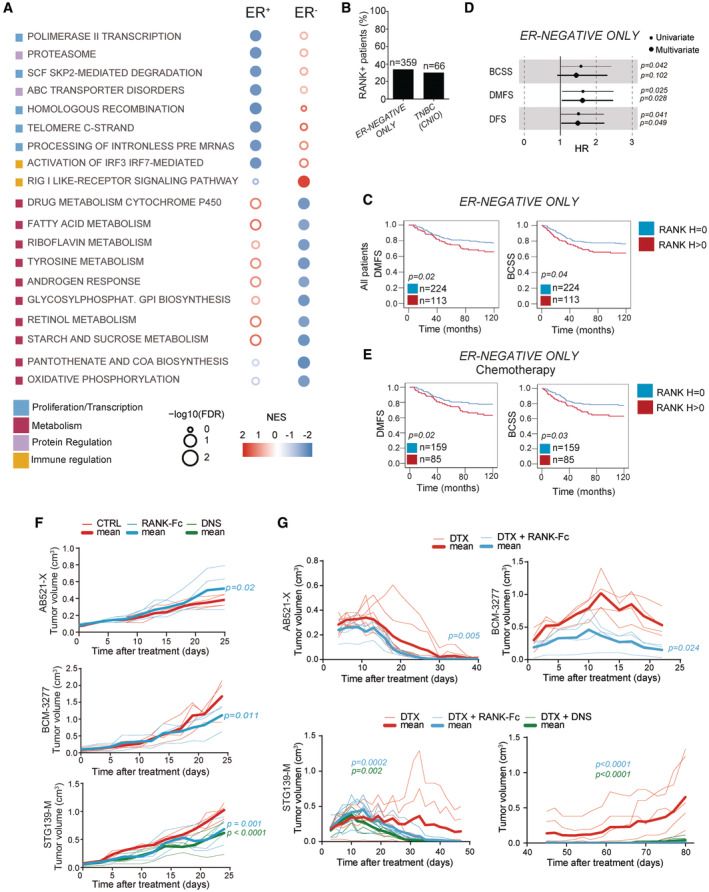
Figure 2. RANK tumor expression associates with poor survival in ER− BC and RANKL inhibition improves response to chemotherapy.

-
ABubble matrix represents GSEA results of pathways associated with RANK protein expression in the METABRIC collection classified by ER expression. The matrix illustrates the NES and FDR values (empty bubbles FDR > 0.25). Color legend indicates the main biological process associated.
-
BPercentage of RANK+ tumors in indicated ER− collections.
-
CDMFS and BCSS according to RANK expression.
-
DForest plots showing HR, 95% CI and uni or multivariate p‐values for the indicated survival parameters.
-
EDMFS and BCSS after chemotherapy (anthracyclines/taxanes) according to RANK expression.
-
F, GTumor growth curves ((π × length × width2)/6) of the indicated PDXs after treatment with RANK‐Fc, denosumab (DNS) or mock (CTRL), alone (F) or in combination with docetaxel (DTX) (G). (G) Bottom left shows tumor growth/regression during DTX/RANKL‐inhibitor treatment for STG139‐M. Bottom right shows the tumor relapse in these same mice after removal of the treatment. Each thin curve represents one single tumor, and each thick curve represents the mean of all tumors implanted. Linear regression analysis and two‐tailed p‐value are shown.
Data information: (B, C, E) Total number of analyzed patients per parameter and p‐values (Log‐rank test (Mantel‐Cox)) are indicated.
