
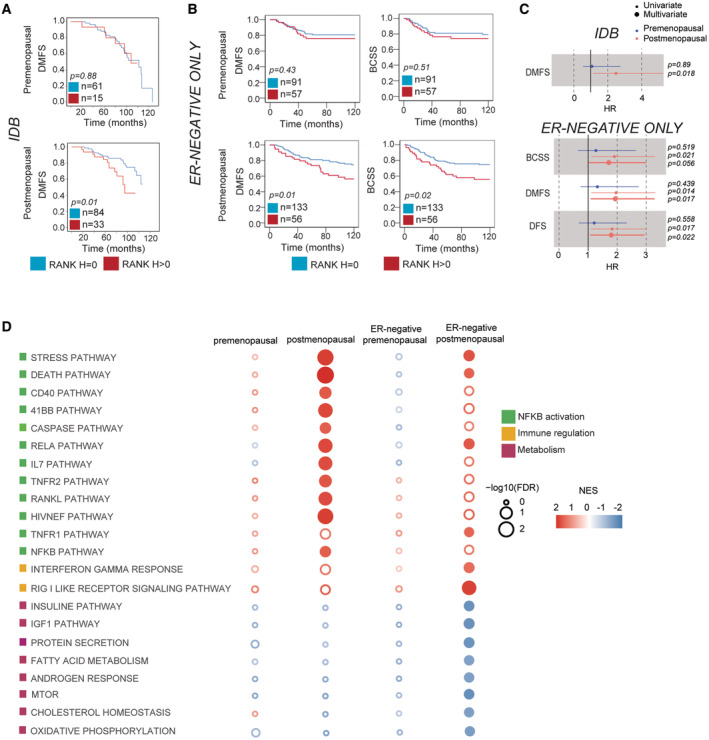
Figure 3. Tumor RANK expression associates with poor survival in postmenopausal patients and RANK biology in BC changes with menopause.
-
A, BDMFS and BCSS according to RANK expression in premenopausal and postmenopausal patients. Total number of analyzed patients per parameter and p‐values (Log‐rank test (Mantel‐Cox)) are indicated.
-
CForest plots showing HR, 95% CI and uni or multivariate p‐values for the indicated survival parameters.
-
DBubble matrix represents GSEA results of pathways associated with RANK protein expression in all patients and in the ER− subset from the METABRIC collection classified by menopausal status. The matrix illustrates the NES and FDR values (Empty bubbles = FDR > 0.25). Color legend indicates the main biological process associated.