
Figure 1. Metabolic disorders in POI patients.
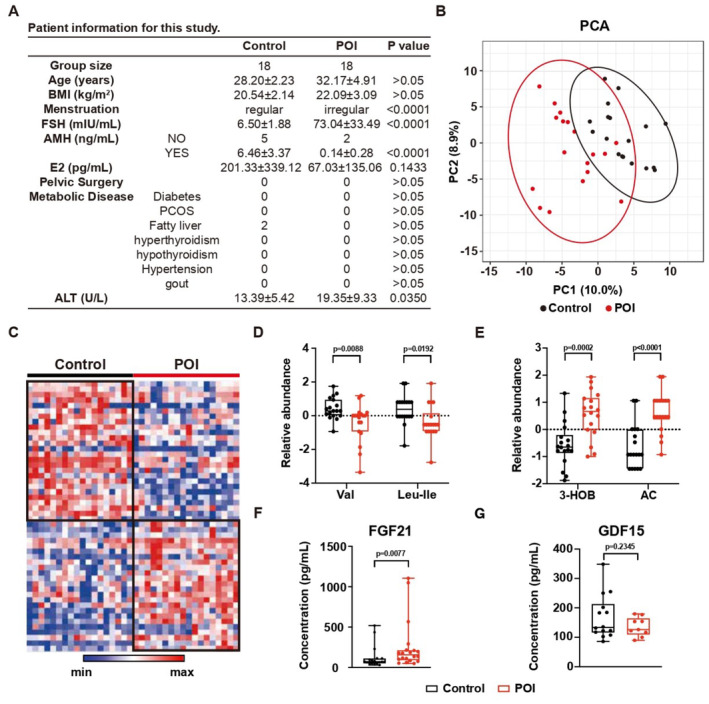
- Clinical information of the cohort.
- PCA of serum metabolomics. Circles indicate 95% confidence intervals. N = 18.
- Heatmap showing the relative abundance of the top 75 differential expressed metabolites. N = 18.
- The relative abundance of valine (Val) and leucine‐isoleucine (Leu‐Ile). N = 18; Boxplot, central band stands for median, boxes stand for 50% of the data, and whiskers stand for min or max of the data.
- The relative abundance of 3‐hydroxybutyrate (3‐HOB) and acetylcarnitine (AC). N = 18; Boxplot, central band stands for median, boxes stand for 50% of the data, and whiskers stand for min or max of the data.
- The concentration of FGF21 in serum. Control, N = 18; POI, N = 20; Boxplot, central band stands for median, boxes stand for 50% of the data, whiskers stand for min or max of the data.
- The concentration of GDF15 in serum. Control, N = 14; POI, N = 9; Boxplot, central band stands for median, boxes stand for 50% of the data, and whiskers stand for min or max of the data.
Data information: Error bars stand for SEM of biological repeats. The P‐value was calculated by a two‐tailed t‐test with 2‐way ANOVA correction.
Source data are available online for this figure.