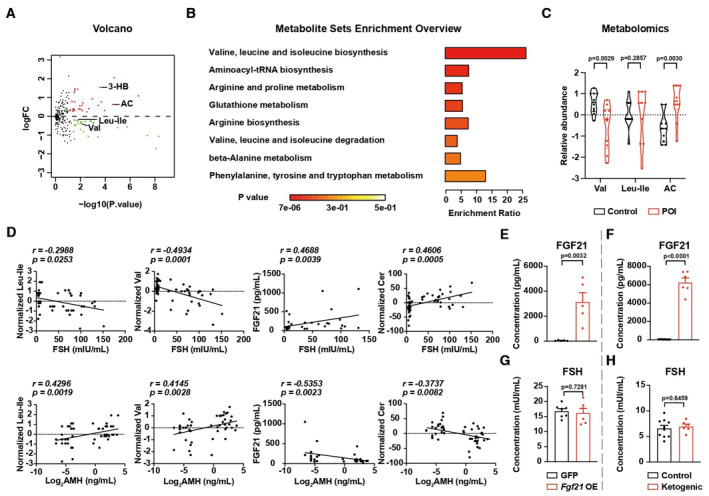
Figure EV1. Metabolic details of POI patients.

-
AVolcano plot showing the fold‐change and P‐value of metabolites. N = 18.
-
BEnrichment score and P‐value of metabolites downregulated in POI patients. N = 18.
-
CRelative abundance of valine (Val), acetyl‐carnitine (AC) but not leucine‐isoleucine (Leu‐Ile) in the serum of the Shandong Cohort. N = 10; Truncated violin plot, central band stands for median, and dotted lines stand for the upper quartile or the lower quartile of the data.
-
DThe correlations between metabolites/FGF21 and clinical parameters. The P and r were calculated by the nonparametric Spearman test. N = 56.
-
E, FThe concentration of FGF21 in mouse serum. (E) N = 5; (F) Control N = 10; Ketogenic diet, N = 6.
-
G, HThe concentration of FSH in mouse serum. (G) Control, N = 7; Fgf21 OE, N = 6; and (H) control, N = 10; Ketogenic diet, N = 6.
Data information: Error bars stand for SEM. The P‐value was calculated by a two‐tailed t‐test with 2‐way ANOVA correction.
Source data are available online for this figure.
