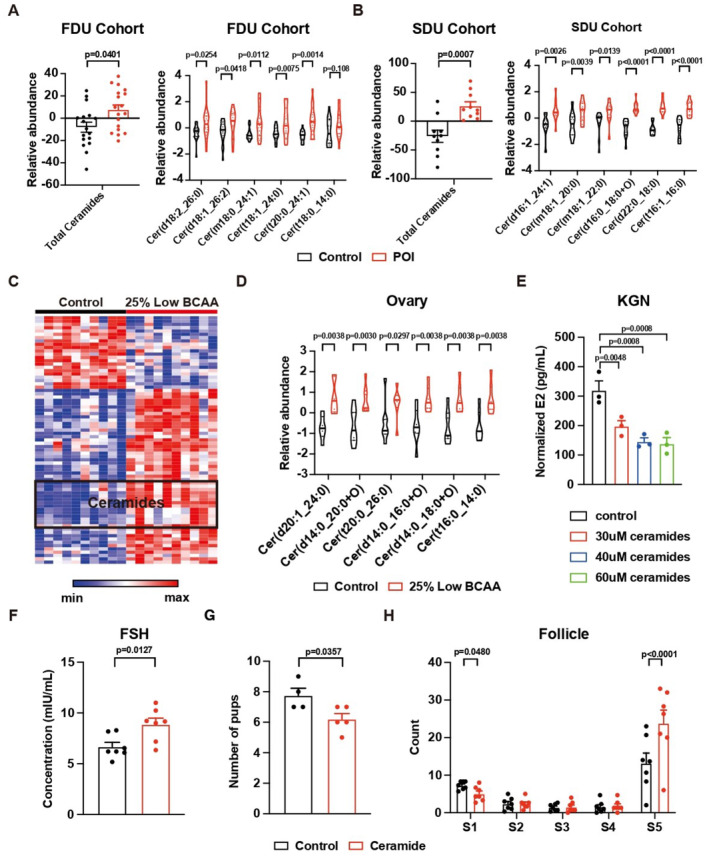
Figure 3. Elevation of ceramide impaired granulosa cell function.

-
A, BElevation of serum ceramide in POI patients from the Fudan Cohort or the Shandong Cohort. Left, the relative abundance of total ceramide; right, the relative abundance of ceramide with specific acyl chain. (A) N = 18; (B) N = 10; Truncated violin plot, central band stands for median, and dotted lines stand for the upper quartile or the lower quartile of the data.
-
CHeatmap showing the top 75 changed lipids in the serum of mice on a low BCAA diet. N = 10.
-
DElevation of ceramide in the ovaries of mice on a low BCAA diet. N = 10; Truncated violin plot, central band stands for median, and dotted lines stand for the upper quartile or the lower quartile of the data.
-
EDecreases of E2 secretions from KGN cells treated with ceramide. N = 3.
-
FThe serum concentration of FSH in mice with ceramide treatment. N = 7.
-
GNumber of pups from mice with ceramide treatment. Control, N = 4; ceramide treatment, N = 5.
-
HThe changes in follicle count from mice with ceramide treatment. N = 7.
Data information: S1, Primordial; S2, Primary; S3, Secondary; S4, Antral; S5, Atretic. Error bars stand for SEM of biological repeats. The P‐value was calculated by a two‐tailed t‐test with 2‐way ANOVA correction.
Source data are available online for this figure.
