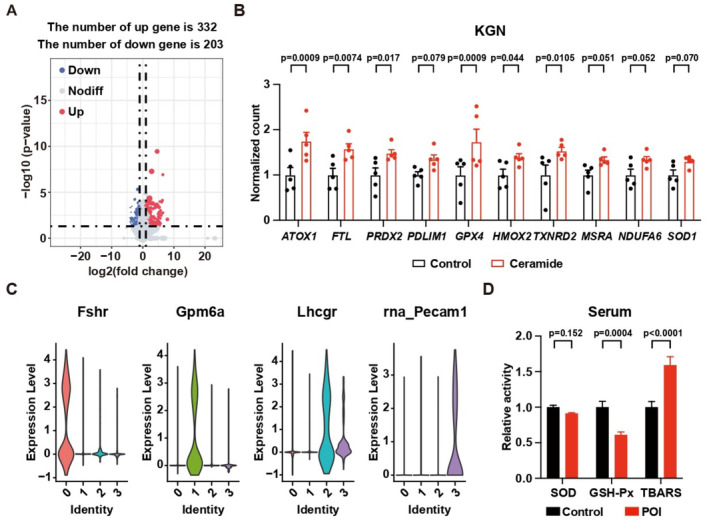
Figure EV3. Low BCAA induces POI via elevation of ROS.

-
AGenes with two‐fold changes and P‐value < 0.05 are highlighted in the volcano plot. N = 5.
-
BUpregulation of ROS‐related genes in KGN cells treated with ceramide. N = 5.
-
CViolin plots showing the expression of classical markers of nonimmune cells in ovaries from sNuc‐seq data.
-
DRelative activity of ROS‐related factors in patients. Control, N = 30; POI, N = 60.
Data information: Error bars stand for SEM. The P‐value was calculated by a two‐tailed t‐test with 2‐way ANOVA correction.
Source data are available online for this figure.
