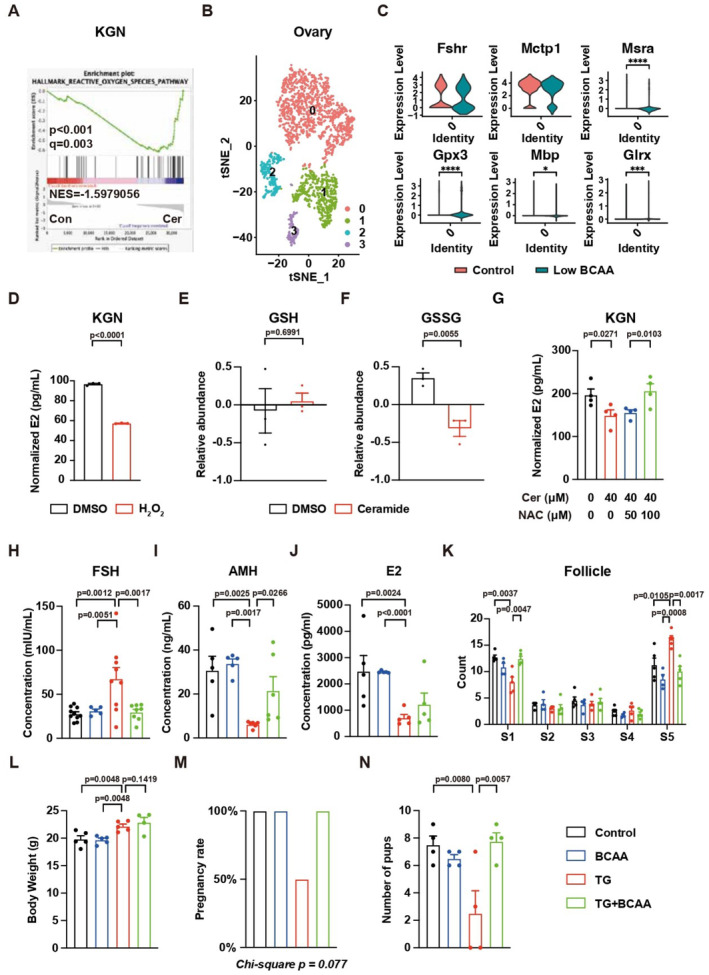
Figure 4. BCAA‐induced POI via ceramide‐ROS axis.

-
AGSEA results of RNA‐seq data. N = 5.
-
BsNuc‐seq data of ovarian nonimmune cells. Granulosa cells (cluster 0), mesothelial cells (cluster 1), thecal cells (cluster 2), and endothelial cells (cluster 3).
-
C, D(C) Relative expression of genes related to ROS in granulosa cells and (D) the concentration of E2 secreted by KGN cells with H2O2 treatment. N = 3.
-
E, FRelative abundance of GSH and GSSG. N = 3.
-
GThe concentration of E2 secreted by KGN cells with ceramide treatment w/o NAC. N = 4.
-
H–JThe serum concentration of FSH, AMH, and E2. (H) Control, N = 10; BCAA, N = 5; TG = 9; TG + BCAA = 8; (I) Control, N = 5; BCAA, N = 5; TG = 6; TG + BCAA = 6; (J) N = 5.
-
KThe changes in follicle count. Control, N = 5; BCAA, N = 4; TG = 5; TG + BCAA = 5.
-
LBody weight. Control, N = 5; BCAA, N = 5; TG = 5; TG + BCAA = 4.
-
MPregnancy rate. N = 4.
-
NNumber of pups from mice with TG or TG + BCAA supplement treatment. N = 4.
Data information: Error bars stand for SEM of biological repeats. The P‐value was calculated by a two‐tailed t‐test with 2‐way ANOVA correction.
Source data are available online for this figure.
