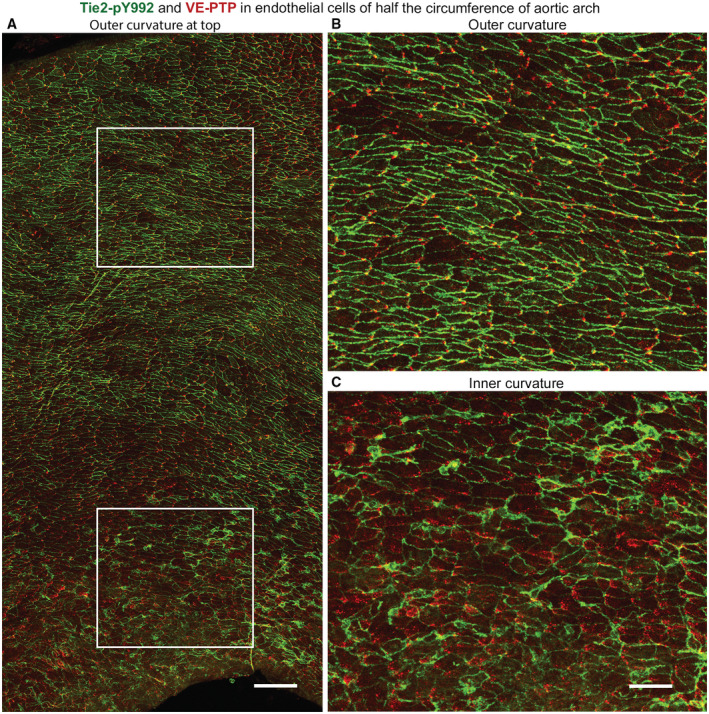
Figure EV2. Regional differences in VE‐PTP and Tie2‐pY992 staining in aortic arch.

-
ALow magnification confocal microscopic tile‐scan image of half the circumference of bisected aortic arch of normal wild‐type mouse. Outer curvature is at the top and inner curvature is at the bottom. VE‐PTP (red) and Tie2‐pY992 (green).
-
B, CRegions in white boxes in (A) are enlarged to show striking differences in VE‐PTP and Tie2‐pY992 staining in the outer curvature in (B) and inner curvature in (C). Regional heterogeneity in VE‐PTP and Tie2‐pY992 staining is also present within the outer curvature and even more so within the inner curvature. Net direction of blood flow is left to right.
Data information: Scale bars: 100 μm in (A), 50 μm in (B and C).
