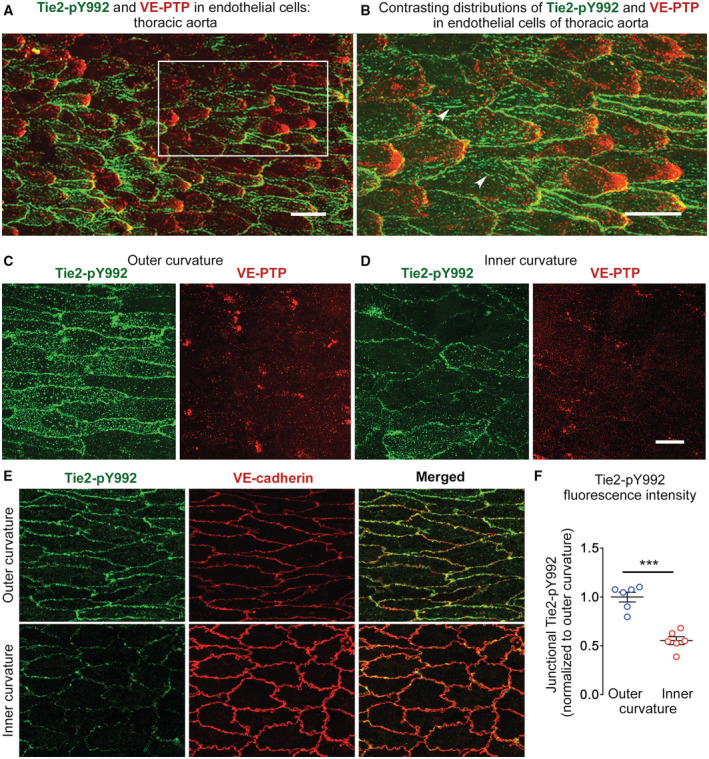
Figure 3. Tie2 phosphorylation, VE‐PTP, and VE‐cadherin distribution in endothelial cells of aorta.

-
AStrong staining for Tie2‐pY992 (green) and polarized VE‐PTP (red) in endothelial cells of thoracic aorta of wild‐type mouse.
-
BEnlargement of region marked by white box in (A), comparing the distributions of Tie2‐pY992 at endothelial cell borders and focal adhesions (arrowheads) with VE‐PTP polarized to the downstream cell tip of endothelial cells.
-
C, DStrong Tie2‐pY992 (green) staining at cell borders and VE‐PTP (red) downstream polarization in outer curvature in (C) in contrast to weak, dispersed staining for Tie2‐pY992 and VE‐PTP in inner curvature in (D) of aortic arch of wild‐type mouse.
-
E, FTie2‐pY992 (green) at endothelial junctions marked by VE‐cadherin (red). (E) Contrasting patterns and intensity of Tie2‐pY992 in outer and inner curvatures. (F) Tie2‐pY992 mean fluorescence intensity at junctions (normalized to outer curvature = 1.0). Mean ± SEM, n = 6 mice/group.
Data information: ***P = 0.000049, by Welch's t‐test in (F). Scale bars: 25 μm in (A), 20 μm in (B–E).
