
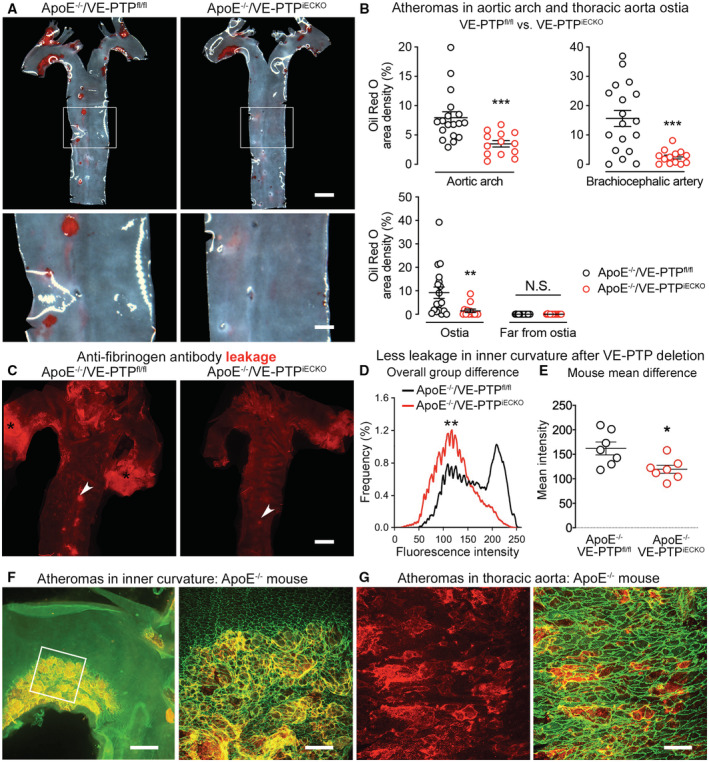
Figure 7. Reduction of atheromas and vascular leakage in ApoE−/− mice with VE‐PTP gene deletion on high‐fat diet.
-
AOil Red O staining of atheromas in ApoE−/−/VE‐PTPfl/fl mice and ApoE−/−/VE‐PTPiECKO mice on high‐fat diet for 10 weeks.
-
BFractional area occupied by Oil Red O‐stained atheromas in aortic arch, brachiocephalic artery, and around or away from intercostal artery ostia. Each dot is value for one mouse. Mean ± SEM, n = 13–18 mice/group.
-
CSites of leakage revealed by extravasated anti‐fibrinogen antibody in aortas of ApoE−/−/VE‐PTPfl/fl mouse (left) and ApoE−/−/VE‐PTPiECKO mouse (right) on high‐fat diet for 7 weeks. Arrowheads mark intercostal artery ostia; black asterisks mark strong leakage at aortic root.
-
D, EFluorescence intensity distributions in (D) and mean intensities in (E) of extravasated anti‐fibrinogen antibody in inner curvature of ApoE−/−/VE‐PTPfl/fl mice and ApoE−/−/VE‐PTPiECKO mice on high‐fat diet for 7 weeks. Mean ± SEM, n = 7 mice/group.
-
F, GAtheromas in ApoE−/− mice marked by extravasated anti‐fibrinogen antibody (red to yellow) in inner curvature at low magnification and enlarged (white box) in (F) and in thoracic aorta in (G). VE‐cadherin (green).
Data information: *P < 0.05, **P < 0.01, ***P < 0.001, by two‐way ANOVA followed by Bonferroni test in (B), Kolmogorov–Smirnov test in (D), and Student's t‐test in (E). N.S. not significant. P = 0.00069 (aortic arch), 0.00017 (brachiocephalic artery), 0.0010 (around ostia in descending thoracic aorta), and 0.99 (far from ostia in descending thoracic aorta) in (B). P = 0.0010 in (D). P = 0.018 in (E). Scale bars: 1 mm in (A) upper row and (C), 300 μm in (A) lower row, 400 μm in (F) left, 100 μm in (F) right, 50 μm in (G).