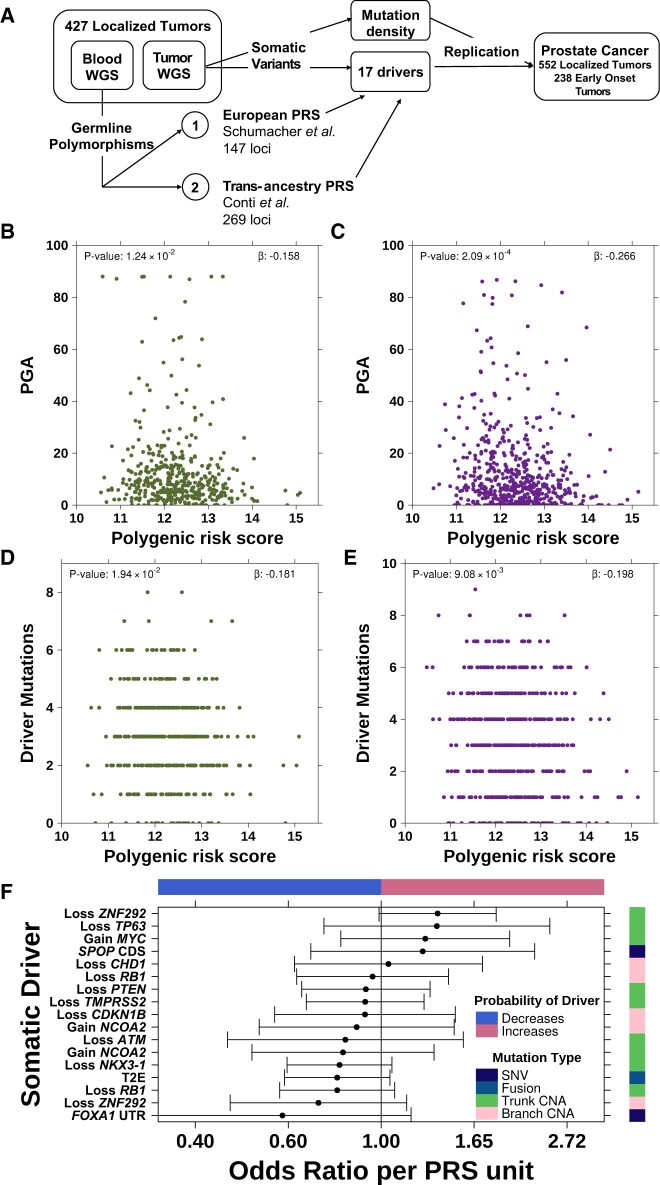
Figure 1.
Genetic risk inversely associated with somatic mutation burden. A) Schematic of polygenic risk score (PRS) associations with the somatic mutational landscape of prostate cancer. The PRS was negatively associated with percent genome altered in both the discovery cohort (B) and the replication cohort (C). Green dots indicate discovery cohort and purple dots indicate replication cohort. The PRS was also negatively associated with the number of driver mutations in both the discovery (D) and replication (E) cohorts. F) PRS is not significantly associated with any individual somatic driver (false discovery rate [FDR] > 0.05). Forest plot shows odds ratio along with 95% confidence interval (x-axis) of PRS associated with each somatic driver (y-axis). Covariate on right indicates the mutation type of each somatic driver while the covariate along the top indicates the direction of effect (ie, whether high inherited risk prevents or promotes the acquisition of each driver mutation). WGS = whole genome sequencing; PGA = percent genome copy number altered; SNV = single nucleotide variant; CNA = copy number aberration.

