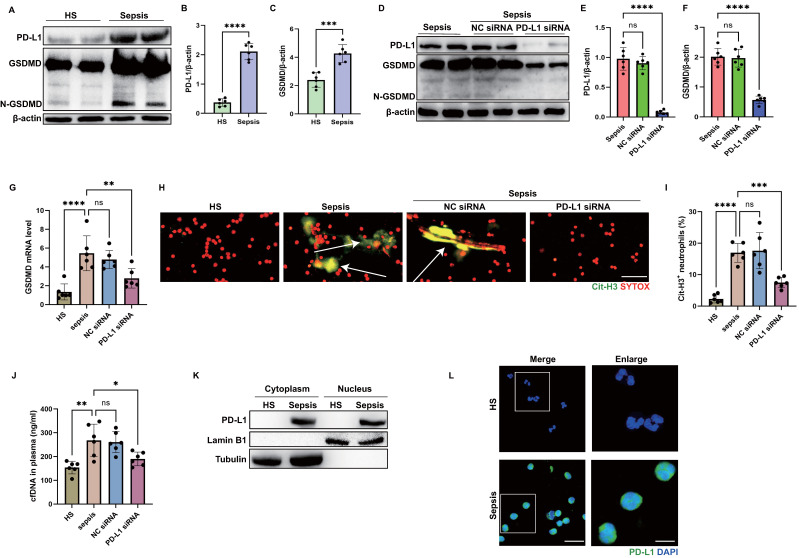
Figure 4.
PD-L1 can regulate GSDMD expression in septic neutrophils. (A to C) Representative immunoblots and quantification of PD-L1 and GSDMD levels in the neutrophils from healthy subjects and septic patients. (D to F) Representative immunoblots and quantification of PD-L1 and GSDMD levels in the neutrophils from septic patients at 21 hours after PD-L1 siRNA treatment. (G) The GSDMD mRNA levels of neutrophils from septic patients at 21 hours after PD-L1 siRNA treatment. (H) Representative immunofluorescence images of isolated peripheral blood neutrophils from healthy subjects and septic patients. Neutrophils are stained with SYTOX Orange (red) and Cit-H3 (green). Arrows indicate NETs. Scale bar indicates 10 μm. (I) Quantification of the percentage of Cit-H3-positive neutrophils. (J) cfDNA levels of supernatant of cultured neutrophils are measured at 21 hours after PD-L1 siRNA treatment. (K) The nucleus is extracted from neutrophils from healthy subjects and septic patients. Representative immunoblot of PD-L1 in neutrophil nucleus. (L) Representative images of neutrophils PD-L1 from healthy subjects and septic patients by confocal microscopy. Neutrophils are stained with PD-L1 (green) and DAPI (blue). Scale bar indicates 10 μm. Higher magnification images are shown at the right row of figures-scale bar indicates 5 μm. The values are presented as mean ± SD (n=6; *P<0.05, **P<0.01, ***P<0.001, ****P<0.0001, ns=not significant, 2-tailed Student's t test for 4B, 4C, 4E, and 4F; one-way analysis of variance for 4G, 4I, 4J).

