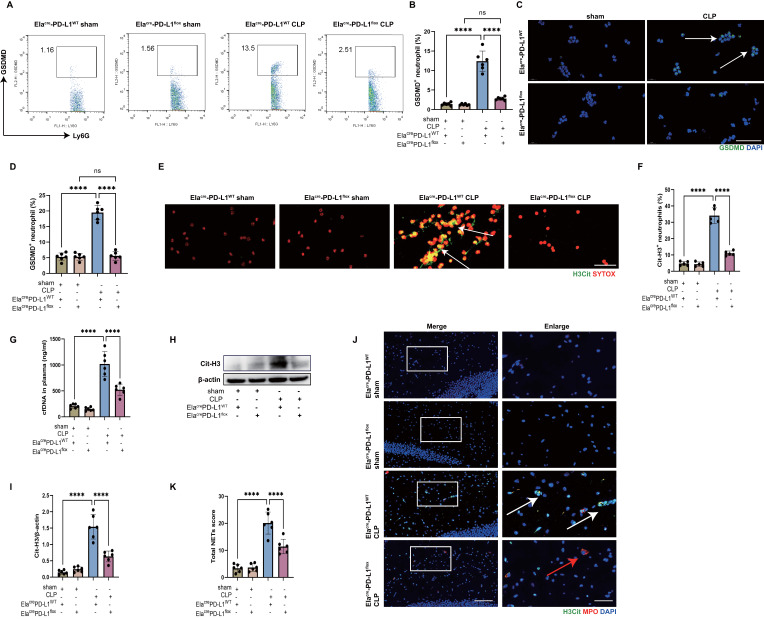
Figure 6.
Genetic deletion of neutrophil PD-L1 reduces the expression of GSDMD in neutrophils in vivo and attenuates the release of NETs in CLP mice. (A and B) Representative FACS plots and quantification of GSDMD+ neutrophils measured by flow cytometry in blood at 24 hours after operation. (C) Representative immunofluorescence images of isolated peripheral blood neutrophils at 24 hours after operation. Neutrophils were stained with GSDMD (green) and DAPI (blue). Scale bar indicates 20 μm. Arrows indicate GSDMD+ neutrophils. (D) Quantification of the percentage of GSDMD-positive neutrophils. (E) Representative immunofluorescence images of isolated peripheral blood neutrophils at 24 hours after operation. Neutrophils are stained with SYTOX Orange (red) and Cit-H3 (green). Arrows indicate NETs. Scale bar indicates 10 μm. (F) Quantification of the percentage of Cit-H3-positive neutrophils. (G) Levels of plasma cfDNA are measured at 24 hours after sham or CLP surgery. (H and I) Representative immunoblots of NETs appearance (H) and quantification of the Cit-H3 levels (I) in the hippocampus at 24 hours after operation. (J) Representative immunofluorescence images of Cit-H3 (green) and MPO (red) staining with blue DAPI nuclear staining in hippocampus. Neutrophils express MPO (red) and NET forming neutrophils also express Cit-H3 (green). Cyan fluorescence represents the colocalization of Cit-H3 with DNA. The white arrows point to neutrophils with NETs and the red arrows to neutrophils without NETs. The scale bar indicates 20 μm. Higher magnification images are shown at the right row of figures-scale bar indicates 10 μm. (K) Total NETs score of each group. The values are presented as mean ± SD (n=6; ****P<0.0001, ns=not significant, one-way analysis of variance).

