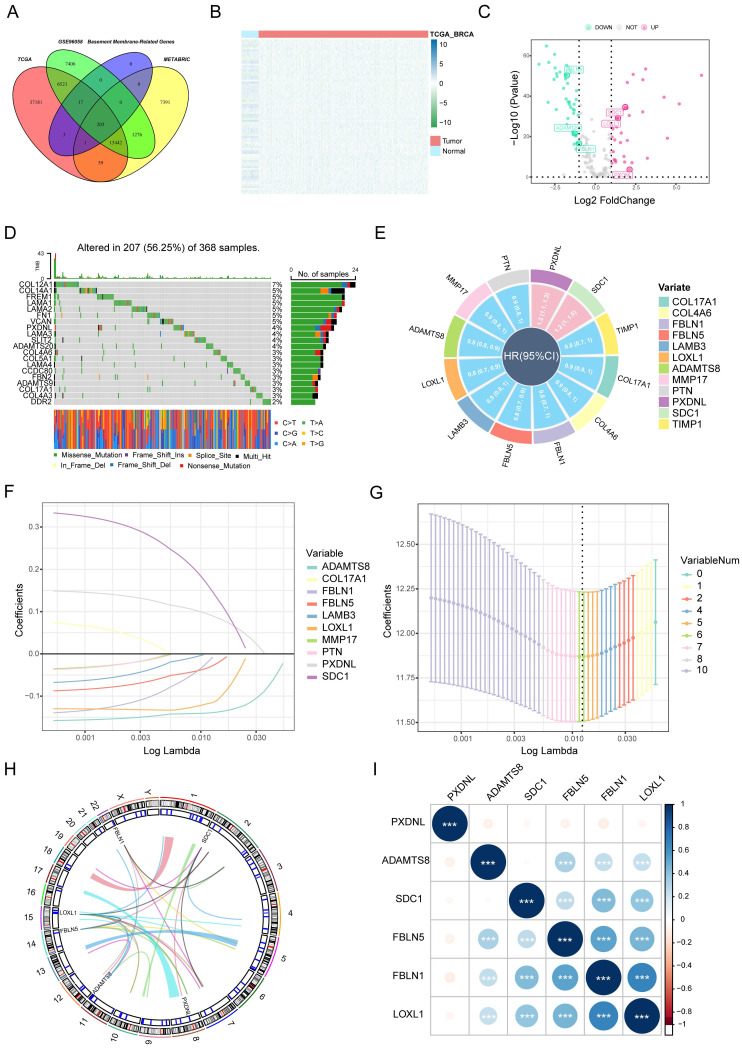
Figure 1.
Selection of candidate BM genes in breast cancer. (A) Venn diagram showing the BM genes shared by TCGA-BRCA, METABRIC and GSE96058. (B and C) Heatmap (B) and volcano plot (C) of differentially expressed BM genes identified in TCGA-BRCA. (D) Diagram of somatic mutations for the top 20 BM genes. (E) Plot visualizing the univariate analysis of OS in TCGA-BRCA. (F and G) Six signature BM genes selected by LASSO Cox regression analysis. (H) Circos plot depicting the locations and expression levels of the six signature genes. (I) Correlation plot for the six signature genes in breast cancer.

