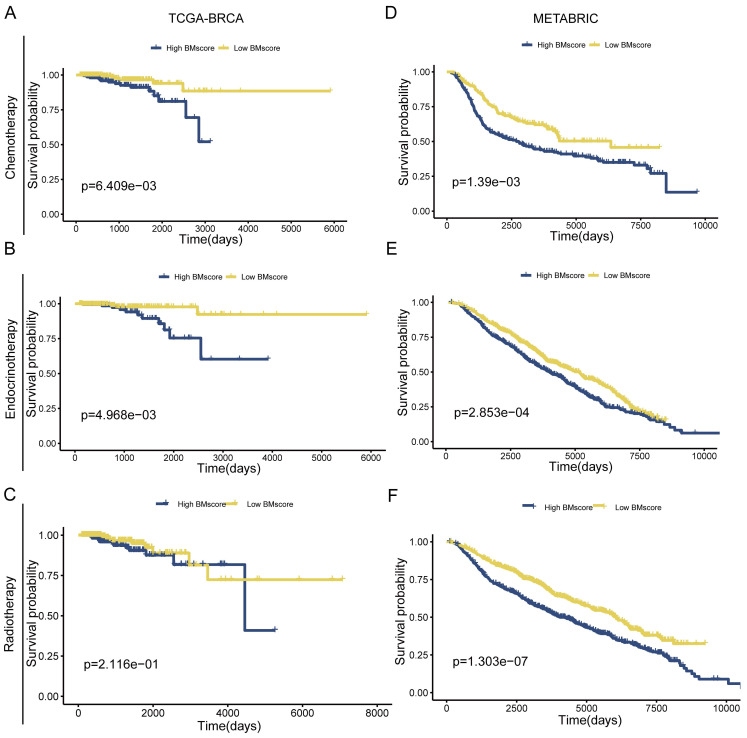
Figure 5.
The implication of the BMscore on breast cancer treatment resistance. (A, B and C) The relationship between the BMscore and treatment sensitivity in TCGA-BRCA, including chemotherapy (A), endocrine therapy (B) and radiotherapy (C). (D, E and F) The relationship between the BMscore and treatment sensitivity in METABRIC, including chemotherapy (D), endocrine therapy (E) and radiotherapy (F).

