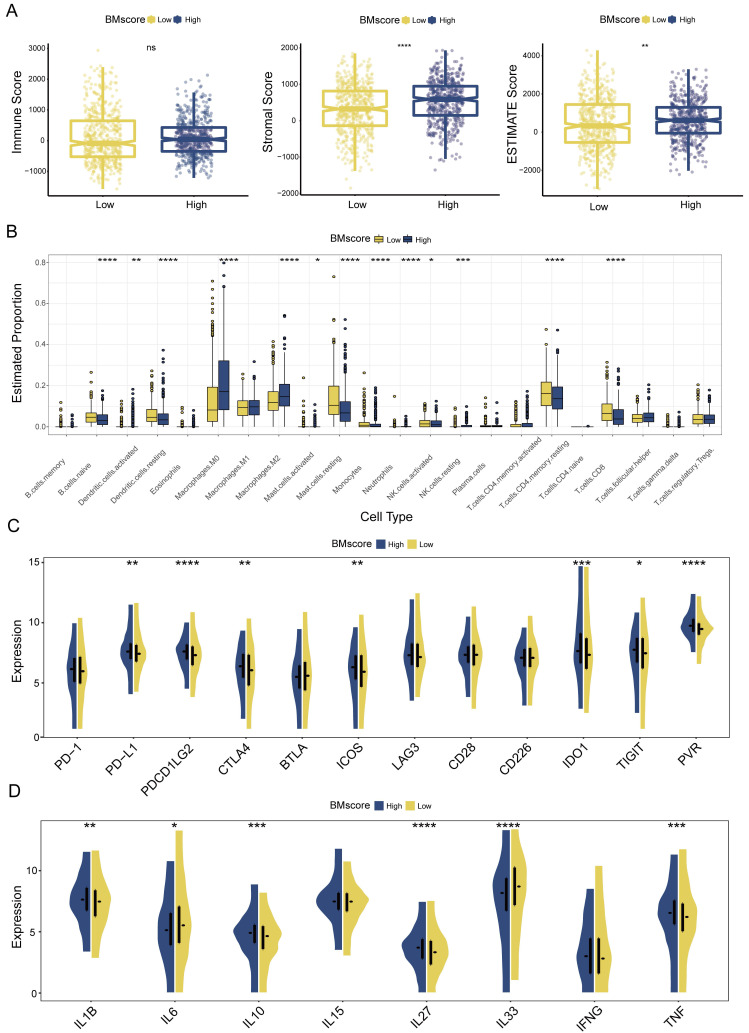
Figure 7.
Estimation of tumor immune infiltration of breast cancer according to the BMscore. (A) Scatterplots of the immune score, stromal score and ESTIMATE score between the high and low BMscore groups. (B) Infiltrating degree of 22 immune cells between the high and low BMscore groups. (C) Expression changes of immune checkpoint markers within different BMscore levels. (D) Changes in cytokine mRNA expression levels based on BMscore levels.

