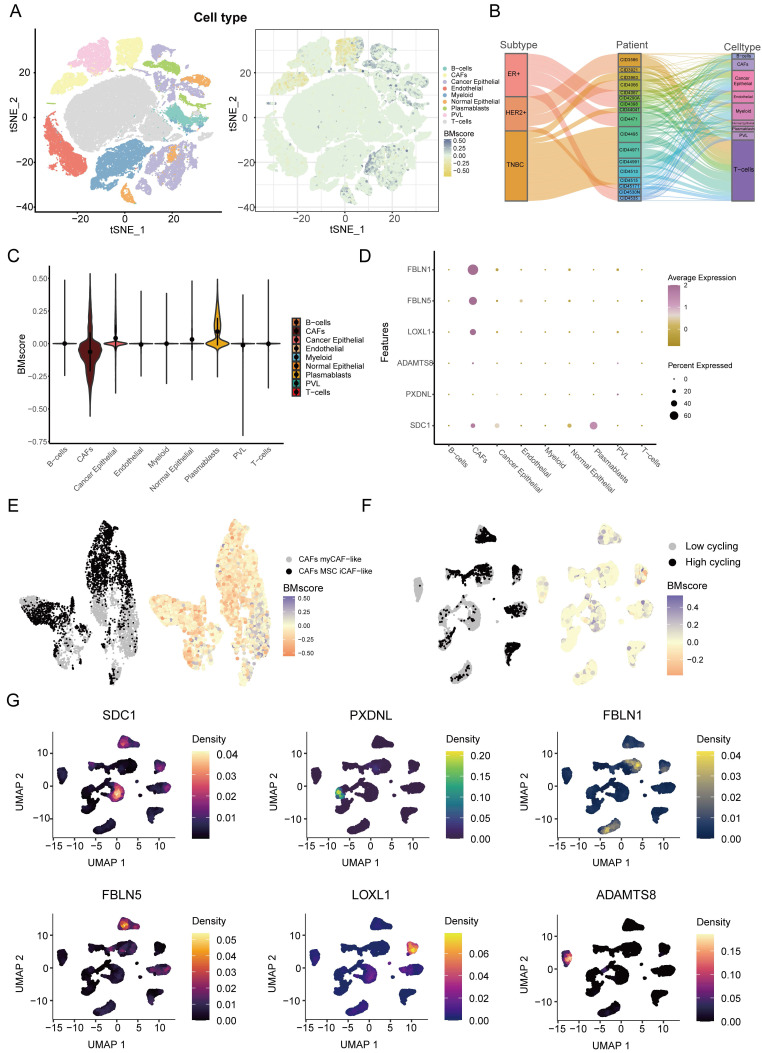
Figure 8.
Dissection of tumor microenvironment based on the BMscore signature. (A) t-SNE plot visualization of all cell subtypes and the distribution of the BMscore from 26 breast cancer patients. Different cell subtypes were annotated by Seurat algorithm. (B) Sankey diagram shows the interrelationship between breast cancer subtypes, patients ID, and cell types in breast cancer patients. (C) Violin plot of the CDI value in different cell types. (D) Bubble plot of the average and percent expression of model genes in different cell subtypes. (E) UMAP plot visualization of the distribution of the CAF subpopulation and BMscore. (F) UMAP plot visualization of high and low cell cycling cancer epithelial cells and expression of model genes.

