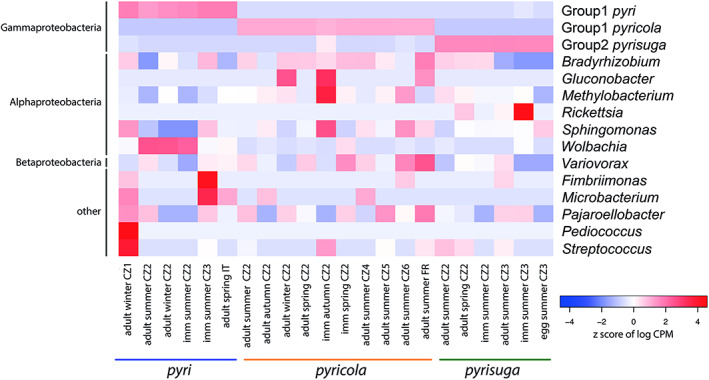
FIGURE 4.

Heatmap showing the abundance (log counts per million) of 15 bacterial genera identified as either indicator species and/or differentially abundant between the three Cacopsylla species. Each column represents several psyllid individuals that are grouped together based on their developmental stage, generation (seasonality) and geographic location. Bacterial genera are ordered based on class level designations represented on the left of the heatmap. Psyllid species are indicated by the coloured bar below the heatmap.
